QI XH, ZHANG MF, YANG JH. Molecular phylogeny of Chinese vegetable mustard ( Brassica juncea) based on the internal transcribed spacers (ITS) of nuclear ribosomal DNA[J]. Genetic Resources and Crop Evolution, 2007, 54(8): 1709-1716. [本文引用:1]
This paper is mainly presented for studying on the origin and evol-ution of rapeseeds,with sprecial reference to the historic investigation ofthe origin of Chinese Brassica cam pestris and B.juncea,and also about theintroduction of B.napus abroad.As mountain-form Pak-Choi and wild-typeblack mustard(
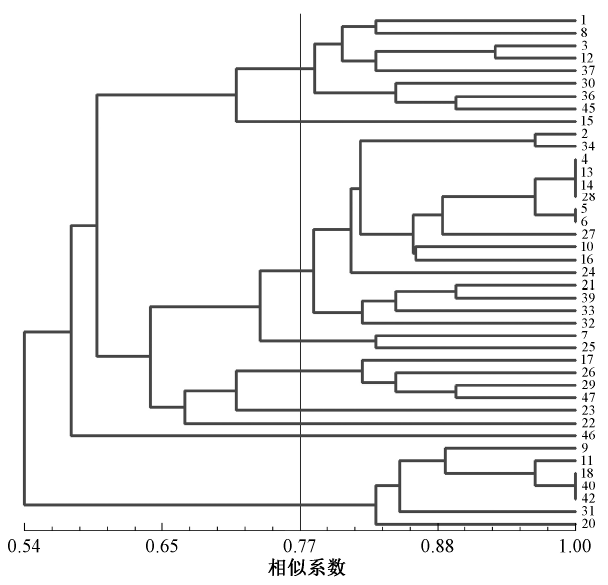
利用SSR分子标记技术分析了23份来自西藏不同地区的芥菜型油菜材料的遗传多样性及其地理分布的相关性.结果表明,基于遗传距离聚类法可将23份供试材料分为3大类群,品种的地理来源同聚类结果具有一定的相关性;13对SSR引物在23份供试材料中共获得58条清晰可辨的条带,其中54条具有多态性,多态性位点比率为93.1%,平均每对SSR引物检测出4.3条条带,其中3.7条条带具有多态性,表现出较高的遗传多样性;23份西藏芥菜类型油菜材料间的遗传相似系数在0.79~0.99,平均值为0.89;野生芥菜型-2与芥菜型油菜-2、野生芥菜型-5与下生分枝野生油菜之间的相似性系数最低,分别为0.79和0.80. Abstract: The genetic diversity and geographical distribution correlation of 23 B. juncea L. rapeseed materials from different areas of Tibet were analyzed by using 13 SSR molecular marker technology. The results showed that 23 test materials could be divided into 3 major groups based on genetic distance clustering method. The geographical origin of eultivars had certain relationship with the clustering results. 58 clear bands were obtained from 23 test materials by using 13 pairs of SSR primers. Among them, 54 bands was polymorphic, the ratio of polymorphic sites was 93.1 %. 4.3 bands were detected by each pair of SSR primer on the average and 3.7 bands were polymorphic with higher genetic diversity. The genetic similarity coefficient among 23 B. juncea L. rapeseed materials in Tibet ranged from 0.79 to 0.99, with the average of 0. 89. The similarity coefficients between wild B. juncea L. -2 and B. juncea L. -2, between wild B. juncea L. -5 and down-branching B. juncea L. were the lowest,being 0.79 and 0. 80 respectively.
... 旦巴等[4,5,6]和宋伟林等[7]先后利用随机扩增多态性DNA(polymerase chain reaction,RAPD)、扩增片段长度多态性(amplified fragment length polymorphism,AFLP)、简单重复序列(simple sequence repeats,SSR)和相关序列扩增多态性(sequence#cod#x02014 ...
Genetic diversity of 73 mustard (Brassica juncea L.) accessions from Tibet Autonomous Region of China and 35 from southwest of China,northwest of China and India were analyzed using 8 SRAP (sequence-related amplified polymorphism) primers combinations on 20 phenotypic traits. SRAP results showed that a total of 139 bands were produced with polymorphism rate of 24.5%. Clustering result of SRAP showed that 108 accessions were divided into 4 groups, and the accessions in each group were mainly from the same region. Genetic diversity index of China Tibet accessions was higher than others. Variation degree of 8 important phenotypic traits of Tibet accessions showed the highest variation coefficiency was 41.29% on silique number per plant. Clustering analysis of phenotypic traits showed that 108 materials were clearly divided into different groups based on their original regions except the accessions from Northwest. In conclusion, Tibet mustard had abundant genetic diversity. The order of genetic diversity indexes from top to bottom was as follows: China Tibet, Southwestern China, Northwestern China and India. Mustard genetic diversity was mainly associated with geological and biological conditions.
【Objective】Rapeseed(B.juncea L.) local germplasm resources would be conserved and utilized in rapeseed breeding more effectively, the genetic diversity in them was studied on molecular level instead of apparent genetics level. 【Method】73 resources in B.juncea L. from Sichuan or other regions were selected, the genetic relationship among them was studied using RAPD marker cluster analyzing and botanical trait cluster analyzing. 119 RAPD primers were used and 25 main botanical traits or 88 trait grades genetic stably were observed.【Results】The tested resources were divided into three groups and 13 units in the RAPD marker cluster analyzing. Qiubeiheiyoucai from Yunnan was the first group, more likely a special original resource. The majority resources in the second group were come from Yunnan. The majority resources in the third group were come from Sichuan(including Chongqing). The second group was divided into two sub-groups. The majority resources in one were come from Guizhou and the majority resources in the other were come from Guizhou and Yunnan. The third group were also divided into two sub-groups. The majority resources in one were come from the regions out of Sichuan and the majority resources in the other were come from Sichuan. The tested resources were divided into six groups and 28 units in the botanical trait cluster analyzing. The resources in the first group were come from Sichuan(including Chongqing). The resources in the second group were come from Sichuan and Guizhou. The majority resources in the third group were come from Yunnan-Guizhou plateau and Qinghai-Xizang plateau. The majority resources in the fourth group were come from Liangshan region in Sichuan and Yunnan-Guizhou plateau. B.carinata L. come from Ethiopia and Changningbendihuangyoucai come from Sichuan were the fifth group. The majority resources in the sixth group were come from Eastern Sichuan, Liangshan region in Sichuan and Yunnan-Guizhou plateau.【Conclusion】The different between resources in B.juncea L. from Sichuan and from Yunnan,Guizhou and other regions was obvious. There was abundant genetic diversity in resources in B.juncea L. from Sichuan. The genetic relationship among resources from different ecological regions or resources from the same ecological regions was near or far, decided by the specific ecological environment and the behavior of human. The genetic relationship and the genetic distance could be identified by RAPD marker cluster analyzing or botanical trait cluster analyzing. But the results from RAPD marker cluster analyzing were more reliable.
A better understanding of genetic diversity and its distribution are essential for its conservation and use. The research of it will help us to determin what and where to be conserved, and improve our understanding of the taxonomy, origin and evolution of plant species. The genetic diversities of 108 accessions including 101 entries of Brassica juncea from western China, 2 from Australia, 4 entries of B. rapa , and 1 entiry of Eruca sativa Mill.were analysed by SRAP with 23 pairs of primer combinations, AFLP with 11 primer combinations, and SSR with 10 pairs of primer combinations. The results showed that totally 313 loci were detected in these materials. The genetic similarity coefficients of 108 accessions varied from 0.378–0.936, while 103 accessions of B. juncea from 0.545–0.936. The clustering analysis indicated that the genetic similarity coefficients of 5 checks including B. rapa , Eruca sativa Mill., were less than 0.558. At the point of genetic similarity coefficient, 0.700, the 103 accessions of B. juncea were divided into 5 groups, those were group A from Yunnan-Guizhou and Southern Shaanxi, group B from Guanzhong of Shaanxi, group C and group D from Xinjiang, and group E from western China. Groups A and B were winter type, groups C, D, and E were spring type. The genetic difference among the accessions in group A was the largest, and higher than that in group B. The accessions from Shaanxi and Xinjiang were distributed into 3 groups respectively, and showed abundant genetic diversity. Group E including the most spring accessions, was divided into 3 sub-groups. The accessions in the sub-group I were from Tibet, with the genetic similarity coefficient higher than 0.83, belonging to an independent genetic system with narrow genetic background. The accessions of yellow mustard in the sub-group II were from Northern Shaanxi, showed higher genetic diversity and belonged to another independent genetic system. In the sub-group III, two accessions from Australia were similar to the spring type in China. Therefore the genetic differences in B. juncea were mainly related to geological and biological conditions. The genetic diversities in winter type of B. juncea were higher than those in spring type in China. The genetic background of B. juncea in Shaanxi and Xinjiang was wide.
To understand the cytoplasmic diversity of B. oleracea and B. juncea , 36 accessions including 15 B. oleracea , 12 B. juncea , 4 B. napus accessions representing different cytoplasm types, 2 B. rapa, 1 B. nigra , 1 B. carinata and 1 Eruca sativa Mill, were analyzed by using the mitochondria and chloroplast-specific SSR markers. Seven of 18 chloroplast specific SSR primers could detect 31 polymorphic bands in total. The mean allele number per locus was 4.43 and the mean of PIC was 0.550 per locus. Two mitochondria-specific SSR primers generated three and five polymorphic bands and the PIC was 0.409 and 0.558 respectively. The genetic similarity coefficients were from 0.538 to 1.000 in 36 accessions according to these markers. The cluster analysis revealed that these 36 accessions could be classified into five major clusters as B. juncea, B. napus and B. rapa, B. carinata and B. nigra, B. oleracea , Eruca sativa Mill at cutoff value 0.700. The results were consistent with the traditional classification. There are four haplotypes in B. juncea and only one in B. oleracea . The cytoplasmic diversity was higher in B. juncea than that in B. oleracea accessions.

 , 任锡亮
, 任锡亮