Journal of Zhejiang Agricultural Sciences ›› 2026, Vol. 67 ›› Issue (9): 2270-2274.DOI: 10.16178/j.issn.0528-9017.20260181
Previous Articles Next Articles
CHEN Guo()
Received:
Online:
Published:
Abstract:
To address the issues of oxidative degradation of vitamin C and severe chromatographic interference in fruit and vegetable matrices,this study optimized the reduction procedure and chromatographic conditions of the existing high-performance liquid chromatography(HPLC)method. The results showed that limits of detection for L-ascorbic acid and D-isoascorbic acid before reduction,and for L-ascorbic acid and D-isoascorbic acid after reduction,were as low as 0.14,0.13,0.35,and 0.32 mg·kg-1,respectively. Both isomers exhibited good linearity within the respective concentration ranges,with coefficient of determination(R2)of no less than 0.999 9. In the three-level(low,medium,and high)spiked recovery experiments(n=7),the recovery rates ranged from 90.0% to 106.0%,with relative standard deviations of no more than 2.5%. The improved method is simple in operation with less matrix interference,and can simultaneously determine the content of vitamin C before and after oxidation,making it suitable for batch detection and routine application for fruit and vegetable samples.
Key words: high-performance liquid chromatography, vitamin C, fruits and vegetables, limit of detection, recovery rate
CLC Number:
O657.7+2
CHEN Guo. Improvement and validation of an HPLC method for the determination of vitamin C in fruits and vegetables[J]. Journal of Zhejiang Agricultural Sciences, 2026, 67(9): 2270-2274.
Recommend
Add to citation manager EndNote|Ris|BibTeX
URL: http://www.zjnykx.cn/EN/10.16178/j.issn.0528-9017.20260181
http://www.zjnykx.cn/EN/Y2026/V67/I9/2270
A相体积
分数/%
B相体积
Table 1 Gradient elution program
Table 2 Linear regression equations,limit of detection and limit of quantification
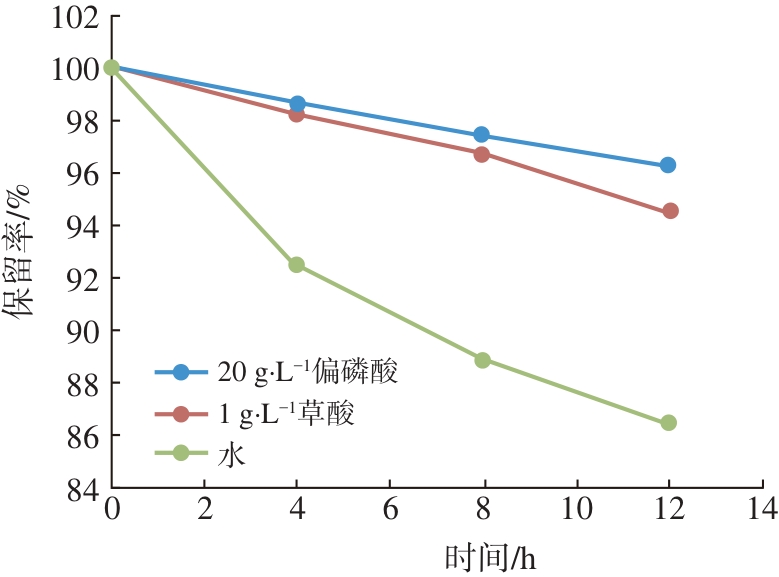
Fig.1 Retention rates of vitamin C in different extraction solvents
Table 3 Recoveries of vitamin C from spiked maize samples
Table 4 Recoveries of vitamin C from spiked citrus samples by two reduction methods
Table 5 Vitamin C content in common fruits and vegetables
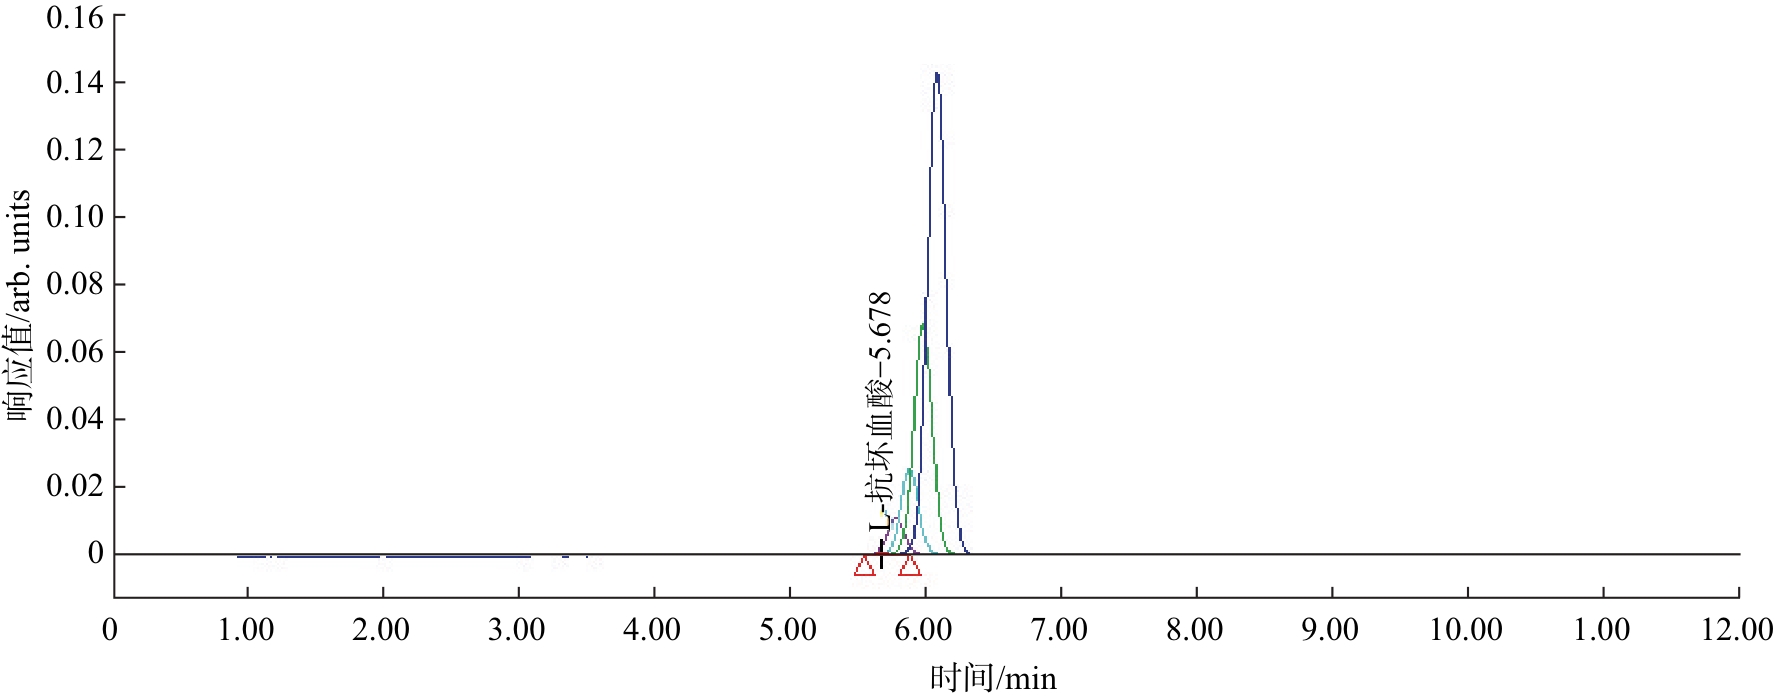
Fig.2 Chromatograms of a series of standard solutions(0.5,5,10,25,50 mg·L-1)under mobile phase scheme 1
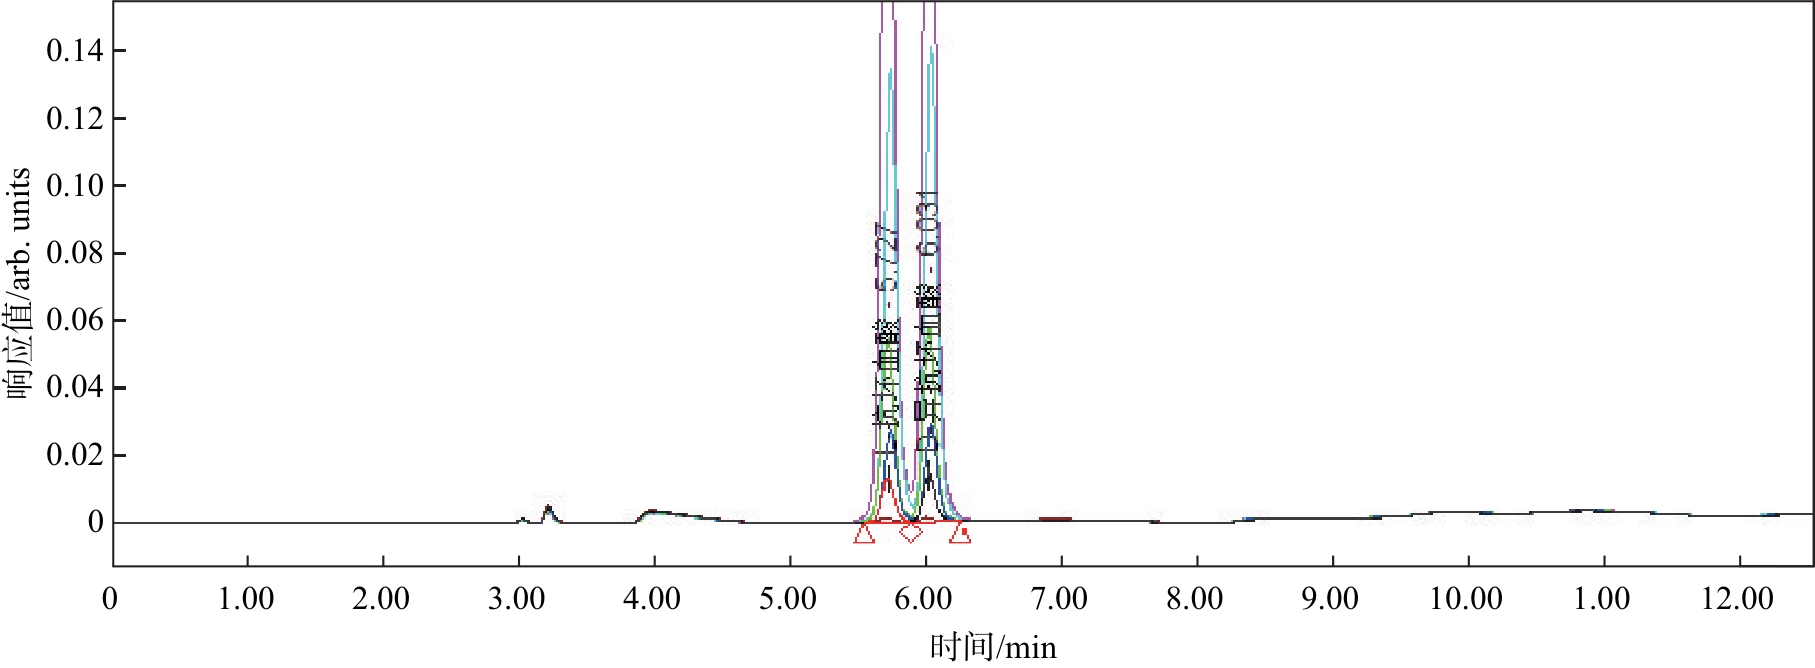
Fig.3 Chromatograms of a series of standard solutions(0.5,5,10,25,50 mg·L?1)under mobile phase scheme 2

 )