Journal of Zhejiang Agricultural Sciences ›› 2026, Vol. 67 ›› Issue (1): 260-270.DOI: 10.16178/j.issn.0528-9017.20250021
Previous Articles Next Articles
LIU Shuyun1( ), HAN Jiabin2,*(), ZHANG Hui3
Received:2025-01-09
Online:2026-01-11
Published:2026-01-19
Contact:
HAN Jiabin
CLC Number:
LIU Shuyun, HAN Jiabin, ZHANG Hui. Production outsourcing services, factor allocation, and agricultural production efficiency[J]. Journal of Zhejiang Agricultural Sciences, 2026, 67(1): 260-270.
Add to citation manager EndNote|Ris|BibTeX
URL: http://www.zjnykx.cn/EN/10.16178/j.issn.0528-9017.20250021
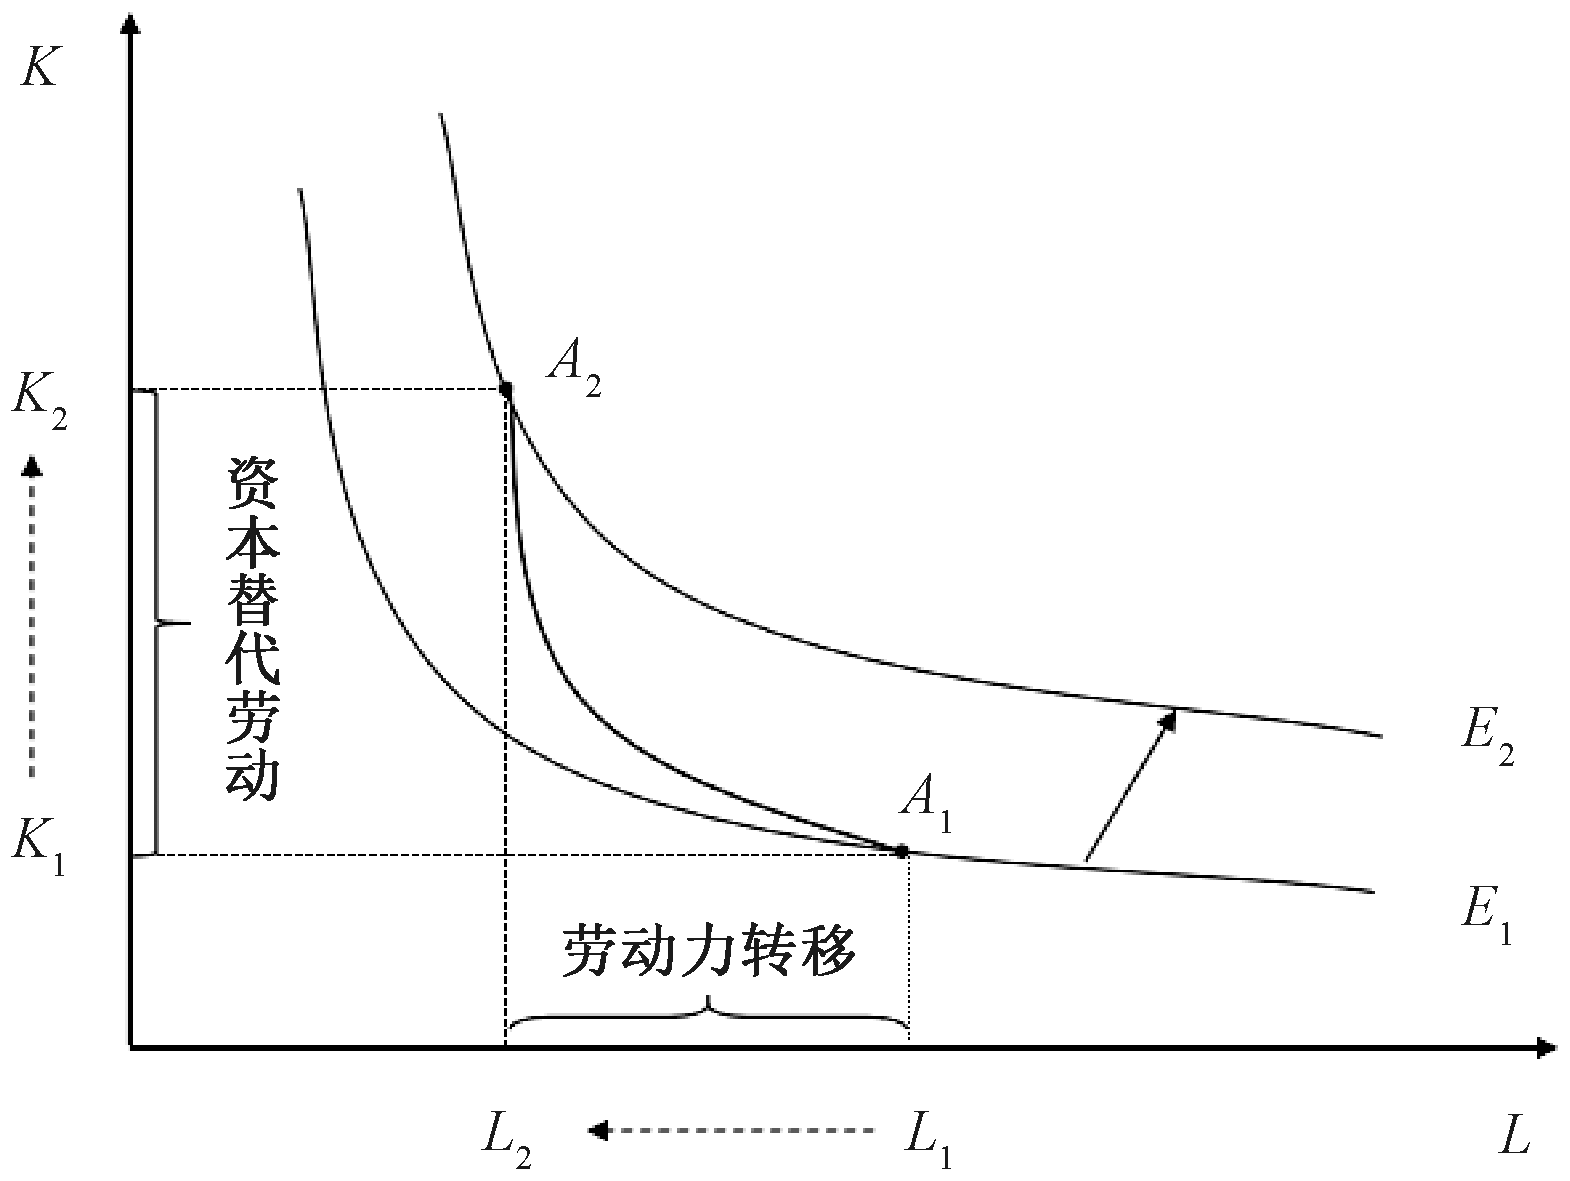
Fig.1 The impact mechanism of production outsourcing services on agricultural production efficiency
| 类型 | 变量名称 | 变量测度 | 均值 | 标准差 |
|---|---|---|---|---|
| 因变量 | 土地生产率* | 单位土地面积粮食产量(kg·hm-2) | 8 046.83 | 1 933.35 |
| 全要素生产率 | 运用SFA方法测算 | 0.81 | 0.14 | |
| 核心自变量 | 生产外包服务 | 农户是否参与农业生产外包服务(1=是,0=否) | 0.83 | 0.38 |
| 中间变量 | 化肥施用强度* | 单位面积化肥投入量(kg·hm-2) | 1 040.10 | 444.83 |
| 农药施用强度* | 单位面积农药费用(元·hm-2) | 1 541.55 | 1 236.30 | |
| 劳动力投入* | 单位面积劳动力投入时间(d·hm-2) | 300.90 | 534.60 | |
| 农户特征变量 | 年龄 | 家庭经营决策者实际年龄(岁) | 61.04 | 9.98 |
| 年龄的平方 | 年龄的平方/100 | 38.26 | 11.74 | |
| 性别 | 家庭经营决策者性别(1=男,0=女) | 0.85 | 0.36 | |
| 文化程度 | 家庭经营决策者受教育年限(年) | 7.03 | 3.69 | |
| 健康状况 | 1=无劳动能力,2=差,3=中,4=良,5=优 | 3.97 | 1.05 | |
| 技术培训 | 是否参与农业技术培训(1=是,0=否) | 0.34 | 0.47 | |
| 风险偏好 | 1=较大,2=中等,3=较小 | 2.72 | 0.56 | |
| 时间偏好 | 1=注重当下收益,2=兼顾当下及未来收益,3=注重未来收益 | 1.67 | 0.72 | |
| 补贴* | 种植业补贴(元) | 3 160.55 | 22 353.90 | |
| 地块特征变量 | 作物类别 | 1=水稻,0=玉米 | 0.79 | 0.41 |
| 耕地面积* | 最大地块的面积(hm2) | 0.20 | 0.30 | |
| 坡度 | 1=平地,0=其他 | 0.93 | 0.26 | |
| 土壤类型 | 1=沙土,2=壤土,3=黏土,4=其他 | 2.27 | 0.91 | |
| 灌溉条件 | 1=能灌溉,0=不能灌溉 | 0.89 | 0.31 | |
| 土壤肥力 | 0=差,1=中,2=好 | 1.36 | 0.63 | |
| 耕地修复情况 | 是否对耕地污染治理修复(1=是,0=否) | 0.06 | 0.24 | |
| 受灾情况 | 该地块是否受灾(1=是,0=否) | 0.29 | 0.45 |
Table 1 Variable definition and descriptive statistical analysis
| 类型 | 变量名称 | 变量测度 | 均值 | 标准差 |
|---|---|---|---|---|
| 因变量 | 土地生产率* | 单位土地面积粮食产量(kg·hm-2) | 8 046.83 | 1 933.35 |
| 全要素生产率 | 运用SFA方法测算 | 0.81 | 0.14 | |
| 核心自变量 | 生产外包服务 | 农户是否参与农业生产外包服务(1=是,0=否) | 0.83 | 0.38 |
| 中间变量 | 化肥施用强度* | 单位面积化肥投入量(kg·hm-2) | 1 040.10 | 444.83 |
| 农药施用强度* | 单位面积农药费用(元·hm-2) | 1 541.55 | 1 236.30 | |
| 劳动力投入* | 单位面积劳动力投入时间(d·hm-2) | 300.90 | 534.60 | |
| 农户特征变量 | 年龄 | 家庭经营决策者实际年龄(岁) | 61.04 | 9.98 |
| 年龄的平方 | 年龄的平方/100 | 38.26 | 11.74 | |
| 性别 | 家庭经营决策者性别(1=男,0=女) | 0.85 | 0.36 | |
| 文化程度 | 家庭经营决策者受教育年限(年) | 7.03 | 3.69 | |
| 健康状况 | 1=无劳动能力,2=差,3=中,4=良,5=优 | 3.97 | 1.05 | |
| 技术培训 | 是否参与农业技术培训(1=是,0=否) | 0.34 | 0.47 | |
| 风险偏好 | 1=较大,2=中等,3=较小 | 2.72 | 0.56 | |
| 时间偏好 | 1=注重当下收益,2=兼顾当下及未来收益,3=注重未来收益 | 1.67 | 0.72 | |
| 补贴* | 种植业补贴(元) | 3 160.55 | 22 353.90 | |
| 地块特征变量 | 作物类别 | 1=水稻,0=玉米 | 0.79 | 0.41 |
| 耕地面积* | 最大地块的面积(hm2) | 0.20 | 0.30 | |
| 坡度 | 1=平地,0=其他 | 0.93 | 0.26 | |
| 土壤类型 | 1=沙土,2=壤土,3=黏土,4=其他 | 2.27 | 0.91 | |
| 灌溉条件 | 1=能灌溉,0=不能灌溉 | 0.89 | 0.31 | |
| 土壤肥力 | 0=差,1=中,2=好 | 1.36 | 0.63 | |
| 耕地修复情况 | 是否对耕地污染治理修复(1=是,0=否) | 0.06 | 0.24 | |
| 受灾情况 | 该地块是否受灾(1=是,0=否) | 0.29 | 0.45 |
| 变量 | 化肥施用强度/ (kg·hm-2) | 农药施用强度/ (元·hm-2) | 劳动力投入/ (d·hm-2) | 土地生产率/ (kg·hm-2) | 全要素 生产率 | 农户 数量 | 农户数量 占比/% | |
|---|---|---|---|---|---|---|---|---|
| 农户参与生产外包服务环节数量 | 0 | 973.13(480.75) | 1 666.50(1 317.90) | 464.25(798.30) | 7 662.00(1 992.00) | 0.776 1(0.18) | 321 | 17.01 |
| 1 | 1 034.33(478.73) | 1 570.65(1 834.50) | 295.05(445.65) | 8 418.38(2 486.25) | 0.831 0(0.13) | 330 | 17.49 | |
| 2 | 1 076.93(480.75) | 1 557.00(883.80) | 248.55(384.60) | 8 171.78(1 628.25) | 0.825 7(0.13) | 562 | 29.78 | |
| 3 | 1 044.08(405.15) | 1 476.00(1 080.45) | 243.45(478.50) | 7 917.68(2 010.00) | 0.800 1(0.15) | 365 | 19.34 | |
| 4 | 1 051.43(396.23) | 1 479.00(1 116.60) | 276.15(523.65) | 8 006.33(1 404.75) | 0.826 3(0.10) | 217 | 11.50 | |
| 5 | 997.13(404.03) | 1 350.75(936.75) | 356.55(598.50) | 7 901.10(1 663.50) | 0.795 6(0.13) | 92 | 4.88 | |
Table 2 Factor input and production efficiency of rural households under different degrees of participation in production outsourcing services
| 变量 | 化肥施用强度/ (kg·hm-2) | 农药施用强度/ (元·hm-2) | 劳动力投入/ (d·hm-2) | 土地生产率/ (kg·hm-2) | 全要素 生产率 | 农户 数量 | 农户数量 占比/% | |
|---|---|---|---|---|---|---|---|---|
| 农户参与生产外包服务环节数量 | 0 | 973.13(480.75) | 1 666.50(1 317.90) | 464.25(798.30) | 7 662.00(1 992.00) | 0.776 1(0.18) | 321 | 17.01 |
| 1 | 1 034.33(478.73) | 1 570.65(1 834.50) | 295.05(445.65) | 8 418.38(2 486.25) | 0.831 0(0.13) | 330 | 17.49 | |
| 2 | 1 076.93(480.75) | 1 557.00(883.80) | 248.55(384.60) | 8 171.78(1 628.25) | 0.825 7(0.13) | 562 | 29.78 | |
| 3 | 1 044.08(405.15) | 1 476.00(1 080.45) | 243.45(478.50) | 7 917.68(2 010.00) | 0.800 1(0.15) | 365 | 19.34 | |
| 4 | 1 051.43(396.23) | 1 479.00(1 116.60) | 276.15(523.65) | 8 006.33(1 404.75) | 0.826 3(0.10) | 217 | 11.50 | |
| 5 | 997.13(404.03) | 1 350.75(936.75) | 356.55(598.50) | 7 901.10(1 663.50) | 0.795 6(0.13) | 92 | 4.88 | |
| 变量 | 被解释变量:土地生产率 | 被解释变量:全要素生产率 | ||
|---|---|---|---|---|
| 模型1 | 模型2 | 模型3 | 模型4 | |
| 生产外包服务 | 0.061**(0.024) | 0.058** (0.025) | 0.035***(0.011) | 0.032***(0.011) |
| 年龄 | 0.002 (0.006) | 0.002 (0.006) | 0.002 (0.003) | 0.001 (0.003) |
| 年龄的平方 | -0.000 (0.005) | -0.000 (0.005) | -0.000 (0.002) | -0.000 (0.002) |
| 性别 | -0.001 (0.021) | 0.006 (0.021) | 0.003 (0.009) | 0.002 (0.009) |
| 文化程度 | 0.004** (0.002) | 0.003 (0.002) | 0.001 (0.001) | 0.001 (0.001) |
| 健康状况 | 0.011 (0.007) | 0.013* (0.007) | 0.005 (0.003) | 0.007** (0.003) |
| 技术培训 | 0.031** (0.015) | 0.013 (0.015) | 0.014** (0.007) | 0.006 (0.007) |
| 风险偏好 | -0.024** (0.010) | -0.020* (0.010) | -0.010** (0.005) | -0.007 (0.005) |
| 时间偏好 | -0.012 (0.010) | 0.016 (0.010) | -0.006 (0.005) | -0.007 (0.005) |
| 补贴 | -0.000 (0.002) | 0.001 (0.003) | 0.002* (0.001) | 0.002* (0.001) |
| 作物类别 | 0.239***(0.025) | 0.300***(0.041) | 0.114***(0.011) | 0.153***(0.017) |
| 耕地面积 | 0.073***(0.014) | 0.039***(0.015) | -0.006 (0.010) | -0.029***(0.011) |
| 坡度 | 0.031 (0.022) | 0.004 (0.023) | 0.021* (0.012) | -0.004 (0.013) |
| 土壤类型 | -0.003 (0.008) | 0.005 (0.010) | -0.002 (0.004) | 0.002 (0.005) |
| 灌溉条件 | 0.066* (0.037) | 0.062* (0.037) | 0.050***(0.016) | 0.047***(0.016) |
| 土壤肥力 | 0.035***(0.011) | 0.032***(0.010) | 0.017***(0.005) | 0.014***(0.005) |
| 耕地修复情况 | 0.064***(0.023) | 0.047** (0.023) | 0.030***(0.012) | 0.023* (0.012) |
| 受灾情况 | -0.084***(0.016) | -0.082***(0.016) | -0.031***(0.007) | -0.032***(0.007) |
| 常数项 | 6.422***(0.176) | 6.414***(0.179) | 0.546***(0.084) | 0.566***(0.082) |
| 年份固定效应 | 是 | 是 | 是 | 是 |
| 个体固定效应 | 否 | 是 | 否 | 是 |
| 调整后R2 | 0.212 | 0.243 | 0.228 | 0.270 |
| 样本量 | 1 715 | 1 698 | 1 715 | 1 698 |
Table 3 Regression results of production outsourcing services on agricultural production efficiency
| 变量 | 被解释变量:土地生产率 | 被解释变量:全要素生产率 | ||
|---|---|---|---|---|
| 模型1 | 模型2 | 模型3 | 模型4 | |
| 生产外包服务 | 0.061**(0.024) | 0.058** (0.025) | 0.035***(0.011) | 0.032***(0.011) |
| 年龄 | 0.002 (0.006) | 0.002 (0.006) | 0.002 (0.003) | 0.001 (0.003) |
| 年龄的平方 | -0.000 (0.005) | -0.000 (0.005) | -0.000 (0.002) | -0.000 (0.002) |
| 性别 | -0.001 (0.021) | 0.006 (0.021) | 0.003 (0.009) | 0.002 (0.009) |
| 文化程度 | 0.004** (0.002) | 0.003 (0.002) | 0.001 (0.001) | 0.001 (0.001) |
| 健康状况 | 0.011 (0.007) | 0.013* (0.007) | 0.005 (0.003) | 0.007** (0.003) |
| 技术培训 | 0.031** (0.015) | 0.013 (0.015) | 0.014** (0.007) | 0.006 (0.007) |
| 风险偏好 | -0.024** (0.010) | -0.020* (0.010) | -0.010** (0.005) | -0.007 (0.005) |
| 时间偏好 | -0.012 (0.010) | 0.016 (0.010) | -0.006 (0.005) | -0.007 (0.005) |
| 补贴 | -0.000 (0.002) | 0.001 (0.003) | 0.002* (0.001) | 0.002* (0.001) |
| 作物类别 | 0.239***(0.025) | 0.300***(0.041) | 0.114***(0.011) | 0.153***(0.017) |
| 耕地面积 | 0.073***(0.014) | 0.039***(0.015) | -0.006 (0.010) | -0.029***(0.011) |
| 坡度 | 0.031 (0.022) | 0.004 (0.023) | 0.021* (0.012) | -0.004 (0.013) |
| 土壤类型 | -0.003 (0.008) | 0.005 (0.010) | -0.002 (0.004) | 0.002 (0.005) |
| 灌溉条件 | 0.066* (0.037) | 0.062* (0.037) | 0.050***(0.016) | 0.047***(0.016) |
| 土壤肥力 | 0.035***(0.011) | 0.032***(0.010) | 0.017***(0.005) | 0.014***(0.005) |
| 耕地修复情况 | 0.064***(0.023) | 0.047** (0.023) | 0.030***(0.012) | 0.023* (0.012) |
| 受灾情况 | -0.084***(0.016) | -0.082***(0.016) | -0.031***(0.007) | -0.032***(0.007) |
| 常数项 | 6.422***(0.176) | 6.414***(0.179) | 0.546***(0.084) | 0.566***(0.082) |
| 年份固定效应 | 是 | 是 | 是 | 是 |
| 个体固定效应 | 否 | 是 | 否 | 是 |
| 调整后R2 | 0.212 | 0.243 | 0.228 | 0.270 |
| 样本量 | 1 715 | 1 698 | 1 715 | 1 698 |
| 变量 | 被解释变量:非径向距离函数模型下的全要素生产率 | |||
|---|---|---|---|---|
| 模型1 | 模型2 | 模型3 | 模型4 | |
| 生产外包服务 | 0.048***(0.017) | 0.041**(0.018) | — | — |
| 外包程度 | — | — | 0.072***(0.020) | 0.078***(0.023) |
| 农户特征 | 是 | 是 | 是 | 是 |
| 地块特征 | 是 | 是 | 是 | 是 |
| 常数项 | 1.628***(0.190) | 1.665***(0.193) | 1.636***(0.190) | 1.671***(0.194) |
| 年份固定效应 | 是 | 是 | 是 | 是 |
| 个体固定效应 | 否 | 是 | 否 | 是 |
| 调整后R2 | 0.852 | 0.853 | 0.852 | 0.854 |
| 样本量 | 1 715 | 1 698 | 1 715 | 1 698 |
Table 4 Results of robustness test
| 变量 | 被解释变量:非径向距离函数模型下的全要素生产率 | |||
|---|---|---|---|---|
| 模型1 | 模型2 | 模型3 | 模型4 | |
| 生产外包服务 | 0.048***(0.017) | 0.041**(0.018) | — | — |
| 外包程度 | — | — | 0.072***(0.020) | 0.078***(0.023) |
| 农户特征 | 是 | 是 | 是 | 是 |
| 地块特征 | 是 | 是 | 是 | 是 |
| 常数项 | 1.628***(0.190) | 1.665***(0.193) | 1.636***(0.190) | 1.671***(0.194) |
| 年份固定效应 | 是 | 是 | 是 | 是 |
| 个体固定效应 | 否 | 是 | 否 | 是 |
| 调整后R2 | 0.852 | 0.853 | 0.852 | 0.854 |
| 样本量 | 1 715 | 1 698 | 1 715 | 1 698 |
| 匹配方法 | 被解释变量:土地生产率(取对数) | 被解释变量:全要素生产率 | ||||
|---|---|---|---|---|---|---|
| 实验组 | 控制组 | ATT | 实验组 | 控制组 | ATT | |
| 核匹配 | 6.953 | 6.882 | 0.070**(0.028) | 0.819 | 0.781 | 0.037***(0.013) |
| k近邻匹配 | 6.953 | 6.894 | 0.059* (0.031) | 0.819 | 0.784 | 0.035** (0.014) |
| 卡尺内最近邻匹配 | 6.953 | 6.893 | 0.059* (0.031) | 0.819 | 0.785 | 0.034** (0.014) |
| 半径匹配 | 6.953 | 6.887 | 0.065**(0.031) | 0.819 | 0.784 | 0.034** (0.013) |
| 局部线性回归匹配 | 6.953 | 6.884 | 0.069* (0.031) | 0.819 | 0.781 | 0.037** (0.017) |
Table 5 PSM estimation results of agricultural production efficiency by production outsourcing services
| 匹配方法 | 被解释变量:土地生产率(取对数) | 被解释变量:全要素生产率 | ||||
|---|---|---|---|---|---|---|
| 实验组 | 控制组 | ATT | 实验组 | 控制组 | ATT | |
| 核匹配 | 6.953 | 6.882 | 0.070**(0.028) | 0.819 | 0.781 | 0.037***(0.013) |
| k近邻匹配 | 6.953 | 6.894 | 0.059* (0.031) | 0.819 | 0.784 | 0.035** (0.014) |
| 卡尺内最近邻匹配 | 6.953 | 6.893 | 0.059* (0.031) | 0.819 | 0.785 | 0.034** (0.014) |
| 半径匹配 | 6.953 | 6.887 | 0.065**(0.031) | 0.819 | 0.784 | 0.034** (0.013) |
| 局部线性回归匹配 | 6.953 | 6.884 | 0.069* (0.031) | 0.819 | 0.781 | 0.037** (0.017) |
| 变量 | 劳动力投入 模型1 | 化肥施用强度 模型2 | 农药施用强度 模型3 | |
|---|---|---|---|---|
| 生产外包服务 | -0.162** (0.074) | 0.085** (0.042) | -0.040 (0.051) | |
| 年龄 | 0.019 (0.021) | 0.033***(0.012) | 0.014 (0.014) | |
| 年龄的平方 | -0.012 (0.018) | -0.027***(0.010) | -0.012 (0.012) | |
| 性别 | -0.041 (0.064) | -0.003 (0.034) | -0.059 (0.050) | |
| 文化程度 | 0.011 (0.007) | 0.003 (0.004) | -0.002 (0.005) | |
| 健康状况 | 0.069***(0.023) | -0.007 (0.012) | 0.034** (0.017) | |
| 技术培训 | -0.088* (0.051) | -0.033 (0.027) | 0.015 (0.035) | |
| 风险偏好 | -0.010 (0.040) | 0.008 (0.022) | 0.017 (0.033) | |
| 时间偏好 | 0.004 (0.033) | 0.022 (0.017) | 0.031 (0.023) | |
| 补贴 | -0.064***(0.012) | 0.003 (0.006) | 0.014* (0.008) | |
| 作物类别 | 0.052 (0.099) | 0.078 (0.053) | 0.512***(0.082) | |
| 耕地面积 | -0.080 (0.061) | 0.028 (0.031) | -0.053 (0.036) | |
| 坡度 | -0.258***(0.089) | -0.086* (0.045) | -0.022 (0.078) | |
| 土壤类型 | 0.069** (0.033) | 0.023 (0.019) | 0.024 (0.025) | |
| 灌溉条件 | 0.055 (0.095) | -0.031 (0.043) | 0.019 (0.082) | |
| 土壤肥力 | -0.012 (0.036) | -0.041** (0.020) | -0.017 (0.028) | |
| 耕地修复情况 | 0.055 (0.105) | 0.017 (0.051) | 0.041 (0.065) | |
| 受灾情况 | -0.065 (0.050) | 0.021 (0.028) | -0.023 (0.041) | |
| 常数项 | 2.108***(0.642) | 3.742***(0.379) | 3.424***(0.447) | |
| 年份固定效应 | 是 | 是 | 是 | |
| 个体固定效应 | 是 | 是 | 是 | |
| 调整后R2 | 0.119 | 0.113 | 0.145 | |
| 样本量 | 1 698 | 1 648 | 1 680 | |
Table 6 Estimation of the impact of production outsourcing services on farmers' factor inputs
| 变量 | 劳动力投入 模型1 | 化肥施用强度 模型2 | 农药施用强度 模型3 | |
|---|---|---|---|---|
| 生产外包服务 | -0.162** (0.074) | 0.085** (0.042) | -0.040 (0.051) | |
| 年龄 | 0.019 (0.021) | 0.033***(0.012) | 0.014 (0.014) | |
| 年龄的平方 | -0.012 (0.018) | -0.027***(0.010) | -0.012 (0.012) | |
| 性别 | -0.041 (0.064) | -0.003 (0.034) | -0.059 (0.050) | |
| 文化程度 | 0.011 (0.007) | 0.003 (0.004) | -0.002 (0.005) | |
| 健康状况 | 0.069***(0.023) | -0.007 (0.012) | 0.034** (0.017) | |
| 技术培训 | -0.088* (0.051) | -0.033 (0.027) | 0.015 (0.035) | |
| 风险偏好 | -0.010 (0.040) | 0.008 (0.022) | 0.017 (0.033) | |
| 时间偏好 | 0.004 (0.033) | 0.022 (0.017) | 0.031 (0.023) | |
| 补贴 | -0.064***(0.012) | 0.003 (0.006) | 0.014* (0.008) | |
| 作物类别 | 0.052 (0.099) | 0.078 (0.053) | 0.512***(0.082) | |
| 耕地面积 | -0.080 (0.061) | 0.028 (0.031) | -0.053 (0.036) | |
| 坡度 | -0.258***(0.089) | -0.086* (0.045) | -0.022 (0.078) | |
| 土壤类型 | 0.069** (0.033) | 0.023 (0.019) | 0.024 (0.025) | |
| 灌溉条件 | 0.055 (0.095) | -0.031 (0.043) | 0.019 (0.082) | |
| 土壤肥力 | -0.012 (0.036) | -0.041** (0.020) | -0.017 (0.028) | |
| 耕地修复情况 | 0.055 (0.105) | 0.017 (0.051) | 0.041 (0.065) | |
| 受灾情况 | -0.065 (0.050) | 0.021 (0.028) | -0.023 (0.041) | |
| 常数项 | 2.108***(0.642) | 3.742***(0.379) | 3.424***(0.447) | |
| 年份固定效应 | 是 | 是 | 是 | |
| 个体固定效应 | 是 | 是 | 是 | |
| 调整后R2 | 0.119 | 0.113 | 0.145 | |
| 样本量 | 1 698 | 1 648 | 1 680 | |
| 变量 | 估计参数 | 变量 | 估计参数 | 变量 | 估计参数 |
|---|---|---|---|---|---|
| ln L | 0.087(0.088) | ln K | 1.192***(0.243) | ln T | 0.874**(0.419) |
| ln L2 | -0.012***(0.004) | ln K2 | -0.082***(0.022) | ln T2 | -0.248***(0.073) |
| ln LK | -0.004(0.016) | ln LT | 0.024(0.028) | ln KT | 0.135(0.077) |
| ∑ LK | 0.042 | ∑ LT | -0.316 | ∑KT | -0.130 |
| 样本量 | 1 619 | F | 942.63*** | 调整后R2 | 0.840 |
Table 7 Estimation results of transcendental logarithmic production function and factor relationships
| 变量 | 估计参数 | 变量 | 估计参数 | 变量 | 估计参数 |
|---|---|---|---|---|---|
| ln L | 0.087(0.088) | ln K | 1.192***(0.243) | ln T | 0.874**(0.419) |
| ln L2 | -0.012***(0.004) | ln K2 | -0.082***(0.022) | ln T2 | -0.248***(0.073) |
| ln LK | -0.004(0.016) | ln LT | 0.024(0.028) | ln KT | 0.135(0.077) |
| ∑ LK | 0.042 | ∑ LT | -0.316 | ∑KT | -0.130 |
| 样本量 | 1 619 | F | 942.63*** | 调整后R2 | 0.840 |
| 变量 | 0.67 hm2以下农户 | 0.67 hm2及以上农户 | ||
|---|---|---|---|---|
| 模型1 | 模型2 | 模型3 | 模型4 | |
| 生产外包服务 | 0.079**(0.033) | 0.037***(0.014) | 0.020(0.040) | 0.017(0.015) |
| 农户特征 | 是 | 是 | 是 | 是 |
| 地块特征 | 是 | 是 | 是 | 是 |
| 常数项 | 6.425***(0.204) | 0.487***(0.090) | 6.338***(0.400) | 0.741***(0.195) |
| 年份固定效应 | 是 | 是 | 是 | 是 |
| 个体固定效应 | 是 | 是 | 是 | 是 |
| 调整后R2 | 0.221 | 0.286 | 0.339 | 0.854 |
| 样本量 | 1 290 | 1 290 | 391 | 391 |
Table 8 The impact of production outsourcing services on the agricultural production efficiency of rural households with different scales
| 变量 | 0.67 hm2以下农户 | 0.67 hm2及以上农户 | ||
|---|---|---|---|---|
| 模型1 | 模型2 | 模型3 | 模型4 | |
| 生产外包服务 | 0.079**(0.033) | 0.037***(0.014) | 0.020(0.040) | 0.017(0.015) |
| 农户特征 | 是 | 是 | 是 | 是 |
| 地块特征 | 是 | 是 | 是 | 是 |
| 常数项 | 6.425***(0.204) | 0.487***(0.090) | 6.338***(0.400) | 0.741***(0.195) |
| 年份固定效应 | 是 | 是 | 是 | 是 |
| 个体固定效应 | 是 | 是 | 是 | 是 |
| 调整后R2 | 0.221 | 0.286 | 0.339 | 0.854 |
| 样本量 | 1 290 | 1 290 | 391 | 391 |
| 变量 | 被解释变量:土地生产率(对数) | 被解释变量:全要素生产率 | ||
|---|---|---|---|---|
| 模型1 | 模型2 | 模型3 | 模型4 | |
| 劳动节约型外包服务 | 0.060**(0.024) | 0.034***(0.011) | ||
| 技术密集型外包服务 | -0.006(0.015) | 0.002(0.007) | ||
| 农户特征 | 是 | 是 | 是 | 是 |
| 地块特征 | 是 | 是 | 是 | 是 |
| 常数项 | 6.418***(0.178) | 6.469***(0.179) | 0.567***(0.082) | 0.594***(0.082) |
| 年份固定效应 | 是 | 是 | 是 | 是 |
| 个体固定效应 | 是 | 是 | 是 | 是 |
| 调整后R2 | 0.243 | 0.239 | 0.271 | 0.264 |
| 样本量 | 1 698 | 1 698 | 1 698 | 1 698 |
Table 9 The impact of different production outsourcing services on agricultural production efficiency
| 变量 | 被解释变量:土地生产率(对数) | 被解释变量:全要素生产率 | ||
|---|---|---|---|---|
| 模型1 | 模型2 | 模型3 | 模型4 | |
| 劳动节约型外包服务 | 0.060**(0.024) | 0.034***(0.011) | ||
| 技术密集型外包服务 | -0.006(0.015) | 0.002(0.007) | ||
| 农户特征 | 是 | 是 | 是 | 是 |
| 地块特征 | 是 | 是 | 是 | 是 |
| 常数项 | 6.418***(0.178) | 6.469***(0.179) | 0.567***(0.082) | 0.594***(0.082) |
| 年份固定效应 | 是 | 是 | 是 | 是 |
| 个体固定效应 | 是 | 是 | 是 | 是 |
| 调整后R2 | 0.243 | 0.239 | 0.271 | 0.264 |
| 样本量 | 1 698 | 1 698 | 1 698 | 1 698 |
| [8] | CHEN Z, LI X J, XIA X L. Study on the effect of reducing cost and increasing income of outsourcing services in agricultural production[J]. Rural Economy, 2022(3): 110-117. |
| [9] | 李克乐, 杨宏力. 农业生产外包服务水平能否提高粮食生产: 基于2011—2020年省际面板数据的分析[J]. 经济体制改革, 2022(5): 83-91. |
| LI K L, YANG H L. Can the level of agricultural production outsourcing services improve food production: based on provincial panel data from 2011 to 2020[J]. Reform of Economic System, 2022(5): 83-91. | |
| [10] | 杨子, 饶芳萍, 诸培新. 农业社会化服务对土地规模经营的影响: 基于农户土地转入视角的实证分析[J]. 中国农村经济, 2019(3): 82-95. |
| YANG Z, RAO F P, ZHU P X. The impact of specialized agricultural services on land scale management: an empirical analysis from the perspective of farmers' land transfer-in[J]. Chinese Rural Economy, 2019(3): 82-95. | |
| [11] | 牛秋纯, 李谷成. 农户兼业、农业生产性服务与农业生产效率: 来自全国农村固定观察点的经验证据[J]. 华中农业大学学报(社会科学版), 2024(5): 72-81. |
| NIU Q C, LI G C. Off-farm work, agricultural productive services and production efficiency: empirical evidence from national rural fixed observation points survey[J]. Journal of Huazhong Agricultural University (Social Sciences Edition), 2024(5): 72-81. | |
| [12] | SHENG Y, JACKSON T, GOODAY P. Resource reallocation and its contribution to productivity growth in Australian broadacre agriculture[J]. Australian Journal of Agricultural and Resource Economics, 2017, 61(1): 56-75. |
| [13] | CHEN C R. Untitled land, occupational choice, and agricultural productivity[J]. American Economic Journal: Macroeconomics, 2017, 9(4): 91-121. |
| [14] | 朱喜, 史清华, 盖庆恩. 要素配置扭曲与农业全要素生产率[J]. 经济研究, 2011, 46(5): 86-98. |
| ZHU X, SHI Q H, GAI Q E. Misallocation and TFP in rural China[J]. Economic Research Journal, 2011, 46(5): 86-98. | |
| [15] | 柏培文. 三大产业劳动力无扭曲配置对产出增长的影响[J]. 中国工业经济, 2014(4): 32-44. |
| [1] | 蔡昉, 王美艳. 从穷人经济到规模经济: 发展阶段变化对中国农业提出的挑战[J]. 经济研究, 2016, 51(5): 14-26. |
| CAI F, WANG M Y. Challenges facing China's agriculture as it moves towards a new development stage[J]. Economic Research Journal, 2016, 51(5): 14-26. | |
| [2] | 黄增付. 农民土地转出中的道义理性选择及现实困境: 以核心产粮区典型村庄为例[J]. 农业经济问题, 2016, 37(7): 81-89, 111-112. |
| HUANG Z F. The moral rational choice of farmers' land transfer and realistic predicament: case of typical village in the core area of grain production[J]. Issues in Agricultural Economy, 2016, 37(7): 81-89, 111-112. | |
| [3] | 刘灵辉. 家庭农场土地流转集中的困境与对策[J]. 西北农林科技大学学报(社会科学版), 2019, 19(2): 109-115. |
| LIU L H. Problem and countermeasure of land moderate scale concentration of family farm through land transference[J]. Journal of Northwest A&F University (Social Science Edition), 2019, 19(2): 109-115. | |
| [4] | 钟真, 胡珺祎, 曹世祥. 土地流转与社会化服务: “路线竞争”还是“相得益彰”: 基于山东临沂12个村的案例分析[J]. 中国农村经济, 2020(10): 52-70. |
| ZHONG Z, HU J Y, CAO S X. Land transfer and agricultural services: “route competition” or “mutual reinforcement” an analysis based on cases from 12 villages in Linyi, Shandong Province[J]. Chinese Rural Economy, 2020(10): 52-70. | |
| [5] | LI J P, VATSA P, MA W L. Can mechanized pesticide application help reduce pesticide use and increase crop yield Evidence from rice farmers in Jiangsu Province, China[J]. International Journal of Agricultural Sustainability, 2023, 21(1): 2227809. |
| [6] | 张梦玲, 陈昭玖, 翁贞林, 等. 农业社会化服务对化肥减量施用的影响研究: 基于要素配置的调节效应分析[J]. 农业技术经济, 2023(3): 104-123. |
| ZHANG M L, CHEN Z J, WENG Z L, et al. Research on the influence of agricultural socialized services on fertilizer reduction: based on the regulation effect of element configuration[J]. Journal of Agrotechnical Economics, 2023(3): 104-123. | |
| [7] | 康晨, 刘家成, 徐志刚. 农业生产外包服务对农村土地流转租金的影响[J]. 中国农村经济, 2020(9): 105-123. |
| KANG C, LIU J C, XU Z G. The impacts of agricultural production outsourcing services on rural land transfer rent[J]. Chinese Rural Economy, 2020(9): 105-123. | |
| [8] | 陈哲, 李晓静, 夏显力. 农业生产环节外包服务的节本增收效应研究[J]. 农村经济, 2022(3): 110-117. |
| [15] | BAI P W. The influence of the labor allocation distortion on social outcomes in the three major industries[J]. China Industrial Economics, 2014(4): 32-44. |
| [16] | 盖庆恩, 李承政, 张无坷, 等. 从小农户经营到规模经营: 土地流转与农业生产效率[J]. 经济研究, 2023, 58(5): 135-152. |
| GAI Q E, LI C Z, ZHANG W K, et al. From smallholders to large-scale farmers: land rental and agricultural productivity[J]. Economic Research Journal, 2023, 58(5): 135-152. | |
| [17] | SCHULTZ T W. Transforming traditional Agriculture[M]. New Haven: Yale University Press, 1964. |
| [18] | 速水佑, RUTTAN V W. Agricultural development: an international perspective[M]. Baltimore: Johns Hopkins Press, 1971. |
| [19] | 赵西亮. 倾向指数匹配方法: 变量选择和模型设定问题[J]. 数量经济技术经济研究, 2015, 32(11): 133-147. |
| ZHAO X L. Matching method of tendency index: variable selection and model setting[J]. The Journal of Quantitative & Technical Economics, 2015, 32(11): 133-147. | |
| [20] | ARRIAGADA R A, SILLS E O, PATTANAYAK S K, et al. Modeling fertilizer externalities around Palo Verde National Park, Costa Rica[J]. Agricultural Economics, 2010, 41(6): 567-575. |
| [21] | 仇焕广, 栾昊, 李瑾, 等. 风险规避对农户化肥过量施用行为的影响[J]. 中国农村经济, 2014(3): 85-96. |
| QIU H G, LUAN H, LI J, et al. Influence of risk aversion on farmers' excessive application of chemical fertilizers[J]. Chinese Rural Economy, 2014(3): 85-96. |
| [1] | XIAO He, CAI Junhuo, ZHU Ziwei, LIAO Wei, ZHONG Wenjun. Current situation and development strategy of the economic aquatic plant industry in Jiangxi Province [J]. Journal of Zhejiang Agricultural Sciences, 2025, 66(11): 2802-2808. |
| [2] | XU Jingjing, XUE Zhankui, SHI Jiawei. Current situation and development countermeasures of rape production in Jinhua [J]. Journal of Zhejiang Agricultural Sciences, 2025, 66(9): 2102-2106. |
| [3] | WANG Qiong. Analysis of the integrated development model of agriculture, culture and tourism for Anji white tea [J]. Journal of Zhejiang Agricultural Sciences, 2025, 66(9): 2112-2116. |
| [4] | WANG Peng. Study on digital transformation of rice-shrimp industry—A case study of rice-shrimp in Haiyan County, Jiaxing City [J]. Journal of Zhejiang Agricultural Sciences, 2025, 66(9): 2260-2263. |
| [5] | MENG Huabing, ZHANG Qiyan, ZHOU Jinting, SUN Li, QIN Yebo. Current situation and development suggestions of rice industry in Wuxing District [J]. Journal of Zhejiang Agricultural Sciences, 2025, 66(2): 530-535. |
| [6] | JIANG Xuefang, LI Xiaoying, BAO Xufei, FANG Haojin, WANG Mogen. Research on the path and strategy of high quality development of loquat in Qiandao Lake [J]. Journal of Zhejiang Agricultural Sciences, 2025, 66(2): 536-540. |
| [7] | YANG Yuanjing, YU Jixuan, ZHOU Xinyi. Analysis on the development and e-commerce strategies of kiwifruit industry in Jiangshan City [J]. Journal of Zhejiang Agricultural Sciences, 2025, 66(1): 274-280. |
| [8] | YU Hongjie, WENG Zhihui, CHI Minqing. Current situation of vegetable industry and countermeasures of high quality development in Fujian Province [J]. Journal of Zhejiang Agricultural Sciences, 2025, 66(1): 97-102. |
| [9] | CHEN Tao, SHEN Binliang, CAI Renxiang, ZHANG Weijiang. Current situation and development countermeasures of characteristic crops in Zhejiang Province [J]. Journal of Zhejiang Agricultural Sciences, 2024, 65(8): 1751-1754. |
| [10] | ZHU Chunmei, MAO Yunlong, SHEN Binliang. Reflection and exploration on the high quality development of fresh grape industry in Changxing County [J]. Journal of Zhejiang Agricultural Sciences, 2024, 65(8): 1833-1837. |
| [11] | . [J]. Journal of Zhejiang Agricultural Sciences, 2023, 64(2): 304-307. |
| [12] | . [J]. Journal of Zhejiang Agricultural Sciences, 2021, 62(4): 714-718. |
| [13] | . [J]. Journal of Zhejiang Agricultural Sciences, 2021, 62(3): 623-626. |
| [14] | . [J]. Journal of Zhejiang Agricultural Sciences, 2021, 62(1): 220-224. |
| [15] | . [J]. Journal of Zhejiang Agricultural Sciences, 2020, 61(12): 2489-2493. |
| Viewed | ||||||
|
Full text |
|
|||||
|
Abstract |
|
|||||