浙江农业科学 ›› 2026, Vol. 67 ›› Issue (10): 2576-2584.DOI: 10.16178/j.issn.0528-9017.20250621

• 农业经济与信息 • 上一篇    下一篇

辽宁省县域经济发展水平测度及空间格局分析

刘铮1(), 刘欣宇2(), 王劲松3, 李元鑫1, 赵月峰1, 郝旭然1   

  1. 1.辽宁省农业科学院,辽宁 沈阳 110161
    2.中国农业大学 有机循环研究院(苏州),江苏 苏州 215100
    3.沈阳农业大学 经济管理学院,辽宁 沈阳 110866
  • 收稿日期:2025-08-28 出版日期:2026-10-11 发布日期:2026-10-19
  • 通讯作者: 刘欣宇
  • 作者简介:刘欣宇,E-mail:liuxinyu@slaas.cn。
    刘铮,主要从事农业经济研究。E-mail:liuzheng@laas.cn。
  • 基金资助:
    辽宁省社会科学规划基金项目重点委托项目(L25AWT028)

Measurement and spatial pattern analysis of county economic development level in Liaoning Province

LIU Zheng1(), LIU Xinyu2(), WANG Jinsong3, LI Yuanxin1, ZHAO Yuefeng1, HAO Xuran1   

  1. 1.Liaoning Academy of Agricultural Sciences,Shenyang 110161,Liaoning
    2.Organic Recycling Research Institute(Suzhou),China Agricultural University,Suzhou 215100,Jiangsu
    3.The College of Economics and Management,Shenyang Agricultural University,Shenyang 110866,Liaoning
  • Received:2025-08-28 Online:2026-10-11 Published:2026-10-19
  • Contact: LIU Xinyu

摘要:

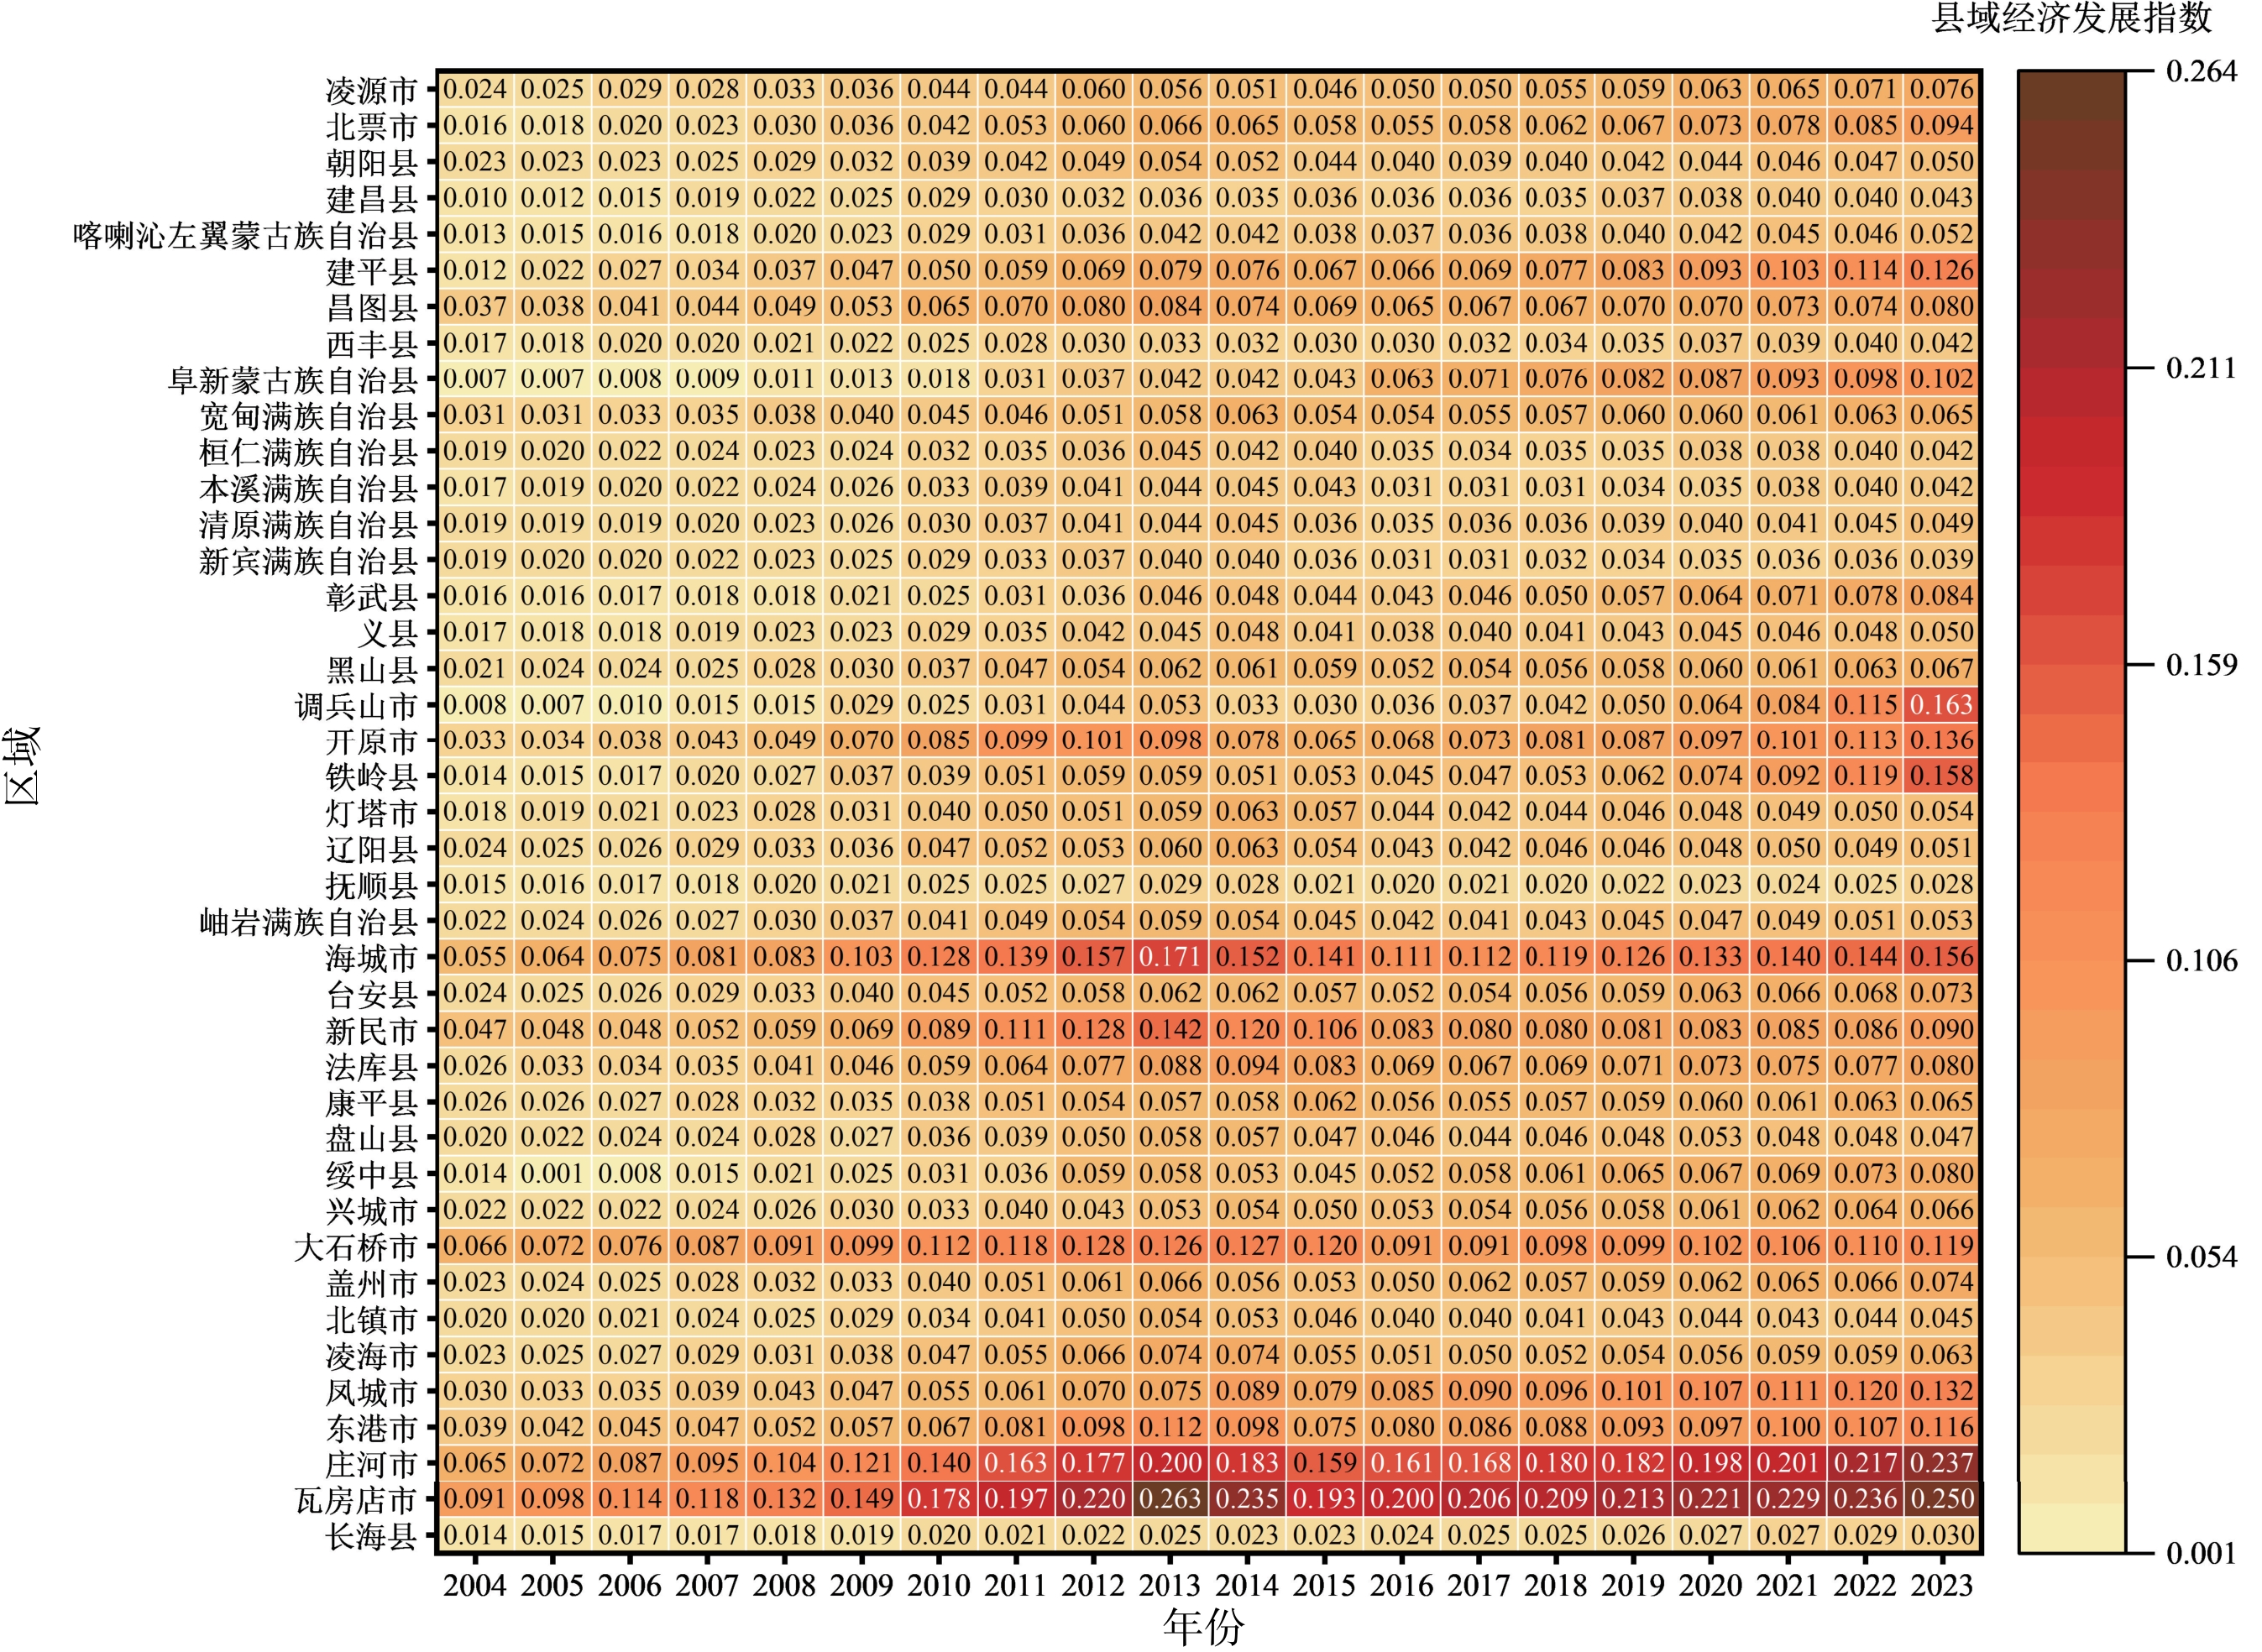
为全面揭示辽宁省县域经济发展的时空演变规律,基于2004—2023年41个县级行政区的相关数据,构建县域经济发展评价指标体系,采用熵值法测算综合发展指数,并运用Dagum基尼系数分解和空间自相关模型,从时间演进、区域差异与空间格局等方面开展系统分析。研究结果表明,辽宁省县域经济发展水平整体呈现稳步提升趋势,2004年大多数县级行政区的县域经济发展指数为0.010~0.040,2023年部分县级行政区已突破0.200,最高达到0.250,显示出整体质量和活力明显增强。区域差异方面,Dagum基尼系数由2004年的0.342下降至2016年的0.266,差距收敛,但此后逐渐回升至2023年的0.303,呈现先收敛、后扩大的动态演变特征,其中区域间差异始终是主要来源,沿海地区内部差异最大,中部地区相对均衡,西北生态脆弱区差异则呈现波动性。空间格局方面,全局莫兰指数(Moran's I)在0.026~0.069波动,整体相关性较弱但始终为正。局部空间自相关显示,新民市长期处于高-高集聚区,而彰武县则一直处于低-高异质区,反映出明显的路径锁定效应。总体来看,辽宁省县域经济发展呈现整体提升与区域分化并存的特征,未来应进一步发挥沿海与中部优势区域的带动作用,强化县域间的空间合作与公共服务均衡配置,推动西北生态脆弱区跨越式发展,从而实现县域经济的协调与可持续发展。

关键词: 辽宁省, 县域经济发展, 熵值法, Dagum基尼系数, 空间自相关

Abstract:

To comprehensively reveal the spatiotemporal evolution of county economic development in Liaoning Province,this study constructed an evaluation index system based on data from 41 county-level administration regions from 2004 to 2023. The entropy method was adopted to calculate the comprehensive development index,and the Dagum Gini coefficient decomposition and spatial autocorrelation models were further applied to systematically analyze the temporal evolution,regional disparities,and spatial patterns. The results showed that the overall county economic development level in Liaoning Province exhibited a steady upward trend. In 2004,the county economic development index of most county-level administration regions ranged from 0.010 to 0.040,while by 2023 some county-level administration regions exceeded 0.200,with the highest reaching 0.250,indicating enhanced overall quality and vitality. Regarding regional disparities,the Dagum Gini coefficient decreased from 0.342 in 2004 to 0.266 in 2016,indicating convergence,but then gradually rose to 0.303 in 2023,displaying a dynamic evolution of first narrowing and then widening. Inter-regional disparity remained the primary source of overall inequality throughout the study period. Among the three regions,the coastal area exhibited the largest intra-regional disparity,the central urban agglomeration area was relatively balanced,and the northwest ecologically fragile area showed fluctuating disparity. In terms of spatial patterns,the global Moran's I index fluctuated between 0.026 and 0.069,indicating weak but consistently positive overall spatial autocorrelation. Local spatial autocorrelation analysis revealed that counties such as Xinmin were persistently in high-high clustering areas,while Zhangwu remained in low-high heterogeneous areas,reflecting a notable path-locking effect. Overall,the county economic development in Liaoning Province is characterized by simultaneous overall improvement and regional divergence. Future efforts should further leverage the driving role of advantaged counties in coastal and central areas,strengthen spatial cooperation and balanced public services among counties,and promote leapfrog development in the northwest ecologically fragile area,so as to achieve coordinated and sustainable county economic development.

Key words: Liaoning Province, county economic development, entropy method, Dagum Gini coefficient, spatial autocorrelation

中图分类号: