Journal of Zhejiang Agricultural Sciences ›› 2026, Vol. 67 ›› Issue (6): 1556-1562.DOI: 10.16178/j.issn.0528-9017.20250199
Previous Articles Next Articles
FENG Dengkui( )
)
Received:2025-03-16
Online:2026-06-11
Published:2026-06-12
CLC Number:
FENG Dengkui. Analysis of agricultural green total factor productivity in the Yangtze River Economic Belt:considering data factor input[J]. Journal of Zhejiang Agricultural Sciences, 2026, 67(6): 1556-1562.
Add to citation manager EndNote|Ris|BibTeX
URL: http://www.zjnykx.cn/EN/10.16178/j.issn.0528-9017.20250199
| 指标 | 类别 | 名称 | 计量方式 |
|---|---|---|---|
投入 指标 | 传统投入要素 | 土地 | 农作物播种面积/hm2 |
| 劳动力 | 第一产业从业人数/104 | ||
| 机械动力 | 农业机械总动力/(104 kW) | ||
| 灌溉 | 有效灌溉面积/hm2 | ||
| 化肥 | 化肥施用折纯量/(104 t) | ||
| 农药 | 农药使用量/(104 t) | ||
| 柴油 | 农用柴油使用量/(104 t) | ||
| 农膜 | 农膜使用量/(104 t) | ||
| 新型投入要素 | 数据要素 | 数据要素 | |
产出 指标 | 期望产出 | 农业总产值 | 农林牧渔业总产值/(108元) |
| 非期望产出 | 碳排放量 | 农业碳排放量/(104 t) |
Table 1 Input-output index system of agricultural green total factor productivity
| 指标 | 类别 | 名称 | 计量方式 |
|---|---|---|---|
投入 指标 | 传统投入要素 | 土地 | 农作物播种面积/hm2 |
| 劳动力 | 第一产业从业人数/104 | ||
| 机械动力 | 农业机械总动力/(104 kW) | ||
| 灌溉 | 有效灌溉面积/hm2 | ||
| 化肥 | 化肥施用折纯量/(104 t) | ||
| 农药 | 农药使用量/(104 t) | ||
| 柴油 | 农用柴油使用量/(104 t) | ||
| 农膜 | 农膜使用量/(104 t) | ||
| 新型投入要素 | 数据要素 | 数据要素 | |
产出 指标 | 期望产出 | 农业总产值 | 农林牧渔业总产值/(108元) |
| 非期望产出 | 碳排放量 | 农业碳排放量/(104 t) |
| 指标 | 指标解释 | 指标属性 | 参考文献 |
|---|---|---|---|
| 农业气象观测站发展情况 | 农业气象观测站数量 | + | [ |
| 农业科技人员占比/% | 农业科技活动人员数除以第一产业从业人员数 | + | [ |
| 生产经营数字化率 | (农业从业人数/总就业人数)×使用互联网技术开展生产经营活动的企业数 | + | [ |
| 人均设施农业温室覆盖度/m-2 | 设施农业温室面积/乡村人口数 | + | [ |
| 农业合作社密度/hm-2 | 农民专业合作社/农用耕地面积 | + | [ |
Table 2 Comprehensive measurement system of agricultural data factor input level
| 指标 | 指标解释 | 指标属性 | 参考文献 |
|---|---|---|---|
| 农业气象观测站发展情况 | 农业气象观测站数量 | + | [ |
| 农业科技人员占比/% | 农业科技活动人员数除以第一产业从业人员数 | + | [ |
| 生产经营数字化率 | (农业从业人数/总就业人数)×使用互联网技术开展生产经营活动的企业数 | + | [ |
| 人均设施农业温室覆盖度/m-2 | 设施农业温室面积/乡村人口数 | + | [ |
| 农业合作社密度/hm-2 | 农民专业合作社/农用耕地面积 | + | [ |
| 指标 | 平均值 | 标准差 | 最大值 | 最小值 |
|---|---|---|---|---|
| 农作物播种面积/hm2 | 6 051.942 | 2 872.899 | 10 227.400 | 255.200 |
| 第一产业从业人数/104 | 873.142 | 516.069 | 1 854.000 | 21.000 |
| 农业机械总动力/(104 kW) | 3 473.728 | 1 964.425 | 7 070.100 | 94.000 |
| 有效灌溉面积/hm2 | 2 241.533 | 1 303.727 | 4 608.800 | 160.600 |
| 化肥施用折纯量/(104 t) | 181.502 | 102.440 | 351.900 | 6.600 |
| 农药使用量/(104 t) | 5.832 | 3.744 | 12.715 | 0.200 |
| 农用柴油使用量/(104 t) | 60.079 | 51.202 | 203.200 | 3.000 |
| 农膜使用量/(104 t) | 7.504 | 3.358 | 13.238 | 1.200 |
| 数据要素 | 0.225 | 0.121 | 0.582 | 0.069 |
| 农林牧渔业总产值/(108 元) | 3 735.809 | 1 875.810 | 7 125.798 | 319.162 |
| 农业碳排放量/(104 t) | 326.228 | 163.296 | 571.644 | 19.210 |
Table 3 Variable descriptive statistics
| 指标 | 平均值 | 标准差 | 最大值 | 最小值 |
|---|---|---|---|---|
| 农作物播种面积/hm2 | 6 051.942 | 2 872.899 | 10 227.400 | 255.200 |
| 第一产业从业人数/104 | 873.142 | 516.069 | 1 854.000 | 21.000 |
| 农业机械总动力/(104 kW) | 3 473.728 | 1 964.425 | 7 070.100 | 94.000 |
| 有效灌溉面积/hm2 | 2 241.533 | 1 303.727 | 4 608.800 | 160.600 |
| 化肥施用折纯量/(104 t) | 181.502 | 102.440 | 351.900 | 6.600 |
| 农药使用量/(104 t) | 5.832 | 3.744 | 12.715 | 0.200 |
| 农用柴油使用量/(104 t) | 60.079 | 51.202 | 203.200 | 3.000 |
| 农膜使用量/(104 t) | 7.504 | 3.358 | 13.238 | 1.200 |
| 数据要素 | 0.225 | 0.121 | 0.582 | 0.069 |
| 农林牧渔业总产值/(108 元) | 3 735.809 | 1 875.810 | 7 125.798 | 319.162 |
| 农业碳排放量/(104 t) | 326.228 | 163.296 | 571.644 | 19.210 |
| 年份 | 绿色全要素生产率变化率 | 技术效率变化率 | 技术进步变化率 | 纯技术效率变化率 | 规模效率变化率 |
|---|---|---|---|---|---|
| 2013—2014 | 0.993 | 1.006 | 0.986 | 0.996 | 1.010 |
| 2014—2015 | 1.012 | 0.974 | 1.044 | 0.944 | 1.036 |
| 2015—2016 | 1.069 | 0.997 | 1.072 | 0.996 | 1.000 |
| 2016—2017 | 0.943 | 0.992 | 0.949 | 0.988 | 1.004 |
| 2017—2018 | 1.014 | 0.996 | 1.024 | 0.986 | 1.010 |
| 2018—2019 | 1.123 | 1.058 | 1.068 | 1.087 | 0.981 |
| 2019—2020 | 1.135 | 1.033 | 1.107 | 1.016 | 1.017 |
| 2020—2021 | 0.968 | 1.049 | 0.923 | 0.993 | 1.056 |
| 2021—2022 | 1.077 | 1.011 | 1.061 | 1.002 | 1.009 |
| 均值 | 1.037 | 1.013 | 1.032 | 1.001 | 1.014 |
Table 4 Agricultural green total factor productivity change in the Yangtze River Economic Belt from 2013 to 2022 and its decomposition
| 年份 | 绿色全要素生产率变化率 | 技术效率变化率 | 技术进步变化率 | 纯技术效率变化率 | 规模效率变化率 |
|---|---|---|---|---|---|
| 2013—2014 | 0.993 | 1.006 | 0.986 | 0.996 | 1.010 |
| 2014—2015 | 1.012 | 0.974 | 1.044 | 0.944 | 1.036 |
| 2015—2016 | 1.069 | 0.997 | 1.072 | 0.996 | 1.000 |
| 2016—2017 | 0.943 | 0.992 | 0.949 | 0.988 | 1.004 |
| 2017—2018 | 1.014 | 0.996 | 1.024 | 0.986 | 1.010 |
| 2018—2019 | 1.123 | 1.058 | 1.068 | 1.087 | 0.981 |
| 2019—2020 | 1.135 | 1.033 | 1.107 | 1.016 | 1.017 |
| 2020—2021 | 0.968 | 1.049 | 0.923 | 0.993 | 1.056 |
| 2021—2022 | 1.077 | 1.011 | 1.061 | 1.002 | 1.009 |
| 均值 | 1.037 | 1.013 | 1.032 | 1.001 | 1.014 |
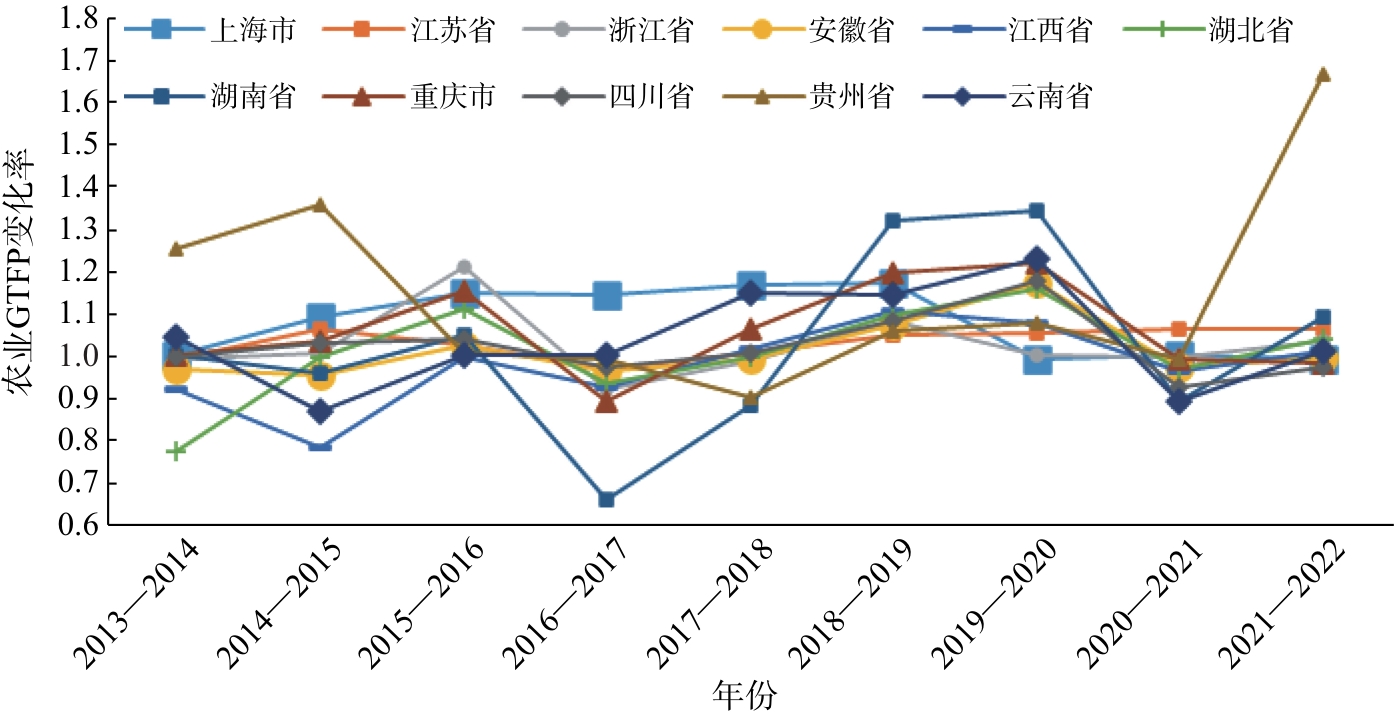
Fig.1 Agricultural green total factor productivity(GTFP) change trend of provinces(municipalities) in the Yangtze River Economic Belt from 2013 to 2022
| 省份 | 农业全要素生产率变化率 | 技术效率变化率 | 技术进步变化率 | 纯技术效率变化率 | 规模效率变化率 |
|---|---|---|---|---|---|
| 上海市 | 1.078 | 0.990 | 1.105 | 1.000 | 0.990 |
| 江苏省 | 1.030 | 1.002 | 1.028 | 1.000 | 1.002 |
| 浙江省 | 1.026 | 1.005 | 1.020 | 1.007 | 0.998 |
| 安徽省 | 1.012 | 0.991 | 1.021 | 0.985 | 1.006 |
| 江西省 | 0.976 | 0.973 | 1.008 | 0.989 | 0.984 |
| 湖北省 | 1.008 | 0.998 | 1.009 | 0.999 | 1.000 |
| 湖南省 | 1.021 | 1.010 | 1.019 | 1.011 | 0.999 |
| 重庆市 | 1.058 | 1.004 | 1.054 | 1.004 | 1.000 |
| 四川省 | 1.021 | 1.006 | 1.015 | 1.000 | 1.006 |
| 贵州省 | 1.143 | 1.116 | 1.084 | 0.975 | 1.146 |
| 云南省 | 1.037 | 1.046 | 0.993 | 1.041 | 1.019 |
Table 5 Agricultural green total factor productivity change and its decomposition in provinces(municipalities)in the Yangtze River Economic Belt from 2013 to 2022
| 省份 | 农业全要素生产率变化率 | 技术效率变化率 | 技术进步变化率 | 纯技术效率变化率 | 规模效率变化率 |
|---|---|---|---|---|---|
| 上海市 | 1.078 | 0.990 | 1.105 | 1.000 | 0.990 |
| 江苏省 | 1.030 | 1.002 | 1.028 | 1.000 | 1.002 |
| 浙江省 | 1.026 | 1.005 | 1.020 | 1.007 | 0.998 |
| 安徽省 | 1.012 | 0.991 | 1.021 | 0.985 | 1.006 |
| 江西省 | 0.976 | 0.973 | 1.008 | 0.989 | 0.984 |
| 湖北省 | 1.008 | 0.998 | 1.009 | 0.999 | 1.000 |
| 湖南省 | 1.021 | 1.010 | 1.019 | 1.011 | 0.999 |
| 重庆市 | 1.058 | 1.004 | 1.054 | 1.004 | 1.000 |
| 四川省 | 1.021 | 1.006 | 1.015 | 1.000 | 1.006 |
| 贵州省 | 1.143 | 1.116 | 1.084 | 0.975 | 1.146 |
| 云南省 | 1.037 | 1.046 | 0.993 | 1.041 | 1.019 |
| [1] | 欧阳日辉. 数据要素促进数字经济和实体经济深度融合的理论逻辑与分析框架[J]. 经济纵横,2024(2):67-78. |
| OUYANG R H. Data as a factor of production promotes the deep integration of the digital economy and the real economy:theoretical logic and analysis framework[J]. Economic Review Journal,2024(2):67-78. | |
| [2] | JONES C I, TONETTI C. Nonrivalry and the economics of data[J]. American Economic Review,2020,110(9):2819-2858. |
| [3] | CONG L W, XIE D X, ZHANG L T. Knowledge accumulation,privacy,and growth in a data economy[J]. Management Science,2021,67(10):6480-6492. |
| [4] | 龚文龙. 数字经济时代数据要素赋能其他生产要素的耦合机制研究[J]. 商业经济研究,2022(6):185-188. |
| GONG W L. Research on the coupling mechanism of data factors enabling other production factors in the digital economy era[J]. Journal of Commercial Economics,2022(6):185-188. | |
| [5] | 潘家栋,胡嘉妍,肖文. 数据要素是否促进了经济增长:基于中国31个省份面板数据的实证分析[J]. 学术交流,2025(1):97-113. |
| PAN J D, HU J Y, XIAO W. Does data factor contribute to economic growth?:an empirical analysis based on panel data from 31 provinces in China[J]. Academic Exchange,2025(1):97-113. | |
| [6] | 王定祥,彭政钦,李伶俐. 中国数字经济与农业融合发展水平测度与评价[J]. 中国农村经济,2023(6):48-71. |
| WANG D X, PENG Z Q, LI L L. Measuring and evaluating the integrated development level of digital economy and agriculture in China[J]. Chinese Rural Economy,2023(6):48-71. | |
| [7] | 王利荣,杨婷. 数农融合能促进农业绿色发展吗?:基于农业绿色全要素生产率的视角[J]. 农业资源与环境学报,2025,42(6):1687-1700. |
| WANG L R, YANG T. Can the integration of digital agriculture promote the green development of agriculture?: perspectives based on green total factor productivity in agriculture[J]. Journal of Agricultural Resources and Environment,2025,42(6):1687-1700. | |
| [8] | 孙聪,夏恩君,黄洁萍,等. 数农融合发展对农业韧性的影响[J]. 经济与管理研究,2024,45(6):76-94. |
| SUN C, XIA E J, HUANG J P,et al. Impact of digital economy-agriculture integration on agricultural resilience[J]. Research on Economics and Management,2024,45(6):76-94. | |
| [9] | 樊胜岳,李耀龙,马晓杰,等. 数字化水平对农业绿色发展影响的实证研究:基于中国30个省份的面板数据[J]. 世界农业,2021(12):4-16. |
| FAN S Y, LI Y L, MA X J,et al. An empirical study of the impact of digital level on agricultural green development:based on the panel data 30 provinces of China[J]. World Agriculture,2021(12):4-16. | |
| [10] | 王巧玲,欧阳耀树. 江西省农业绿色全要素生产率时空演化[J]. 浙江农业科学,2024,65(1):213-219. |
| WANG Q L, OUYANG Y S. Temporal and spatial evolution of agricultural green total factor productivity in Jiangxi Province[J]. Journal of Zhejiang Agricultural Sciences,2024,65(1):213-219. | |
| [11] | 欧阳日辉. 数字经济中经济增长的新动力与新范式[J]. 广东社会科学,2024(1):15-26. |
| OUYANG R H. The new momentum and new paradigm of economic growth in the digital economy[J]. Social Sciences in Guangdong,2024(1):15-26. | |
| [12] | 曾绍伦,杨慧丽,张頔. 考虑数据要素投入的省域制造业全要素生产率及其影响因素研究[J]. 统计与决策,2024,40(23):103-108. |
| ZENG S L, YANG H L, ZHANG D. Study on total factor productivity and its influencing factors of provincial manufacturing industry considering data factor input[J]. Statistics & Decision,2024,40(23):103-108. | |
| [13] | 孙明茜. 数据要素赋能绿色低碳发展的理论逻辑与实践路径[J]. 西南金融,2025(2):44-55. |
| SUN M Q. The theoretical logic and practical path of data elements empowering green and low-carbon development[J]. Southwest Finance,2025(2):44-55. | |
| [14] | OH D H. A global Malmquist-Luenberger productivity index[J]. Journal of Productivity Analysis,2010,34(3):183-197. |
| [15] | LI X F, MA D L. Financial agglomeration,technological innovation,and green total factor energy efficiency[J]. Alexandria Engineering Journal,2021,60(4):4085-4095. |
| [16] | 李波,胡豹. 黄河流域农业绿色全要素生产率实证分析:基于SBM-GML指数模型[J]. 浙江农业科学,2023,64(4):1004-1008. |
| LI B, HU B. Empirical analysis of agricultural green total factor productivity based on SBM-GML index model in the Yellow River Basin[J]. Journal of Zhejiang Agricultural Sciences,2023,64(4):1004-1008. | |
| [17] | 刘红峰,刘惠良. “双碳”目标下湖南省农业绿色全要素生产率分析[J]. 中南林业科技大学学报,2024,44(7):184-192. |
| LIU H F, LIU H L. Analysis of green total factor productivity of agriculture in Hunan Province under the “dual carbon” goal[J]. Journal of Central South University of Forestry & Technology,2024,44(7):184-192. | |
| [18] | 丁宝根,赵玉,邓俊红. 中国种植业碳排放的测度、脱钩特征及驱动因素研究[J]. 中国农业资源与区划,2022,43(5):1-11. |
| DING B G, ZHAO Y, DENG J H. Calculation,decoupling effects and driving factors of carbon emission from planting industry in China[J]. Chinese Journal of Agricultural Resources and Regional Planning,2022,43(5):1-11. | |
| [19] | 陈振,郑锐,李佩华,等. 河南省农业科技创新效率评价与分析[J]. 河南农业大学学报,2018,52(3):464-469. |
| CHEN Z, ZHENG R, LI P H,et al. Evaluation and analysis of agricultural science and technology innovation efficiency in Henan Province[J]. Journal of Henan Agricultural University,2018,52(3):464-469. |
| Viewed | ||||||
|
Full text |
|
|||||
|
Abstract |
|
|||||