浙江农业科学 ›› 2026, Vol. 67 ›› Issue (6): 1522-1528.DOI: 10.16178/j.issn.0528-9017.20250445
王嘉敏1,2( ), 张旭1,2, 吴明江1,2, 苏来金1,2()
收稿日期:2025-06-23
出版日期:2026-06-11
发布日期:2026-06-12
通讯作者:
苏来金
作者简介:苏来金,E-mail:sulj@wzu.edu.cn。基金资助:
WANG Jiamin1,2(), ZHANG Xu1,2, WU Mingjiang1,2, SU Laijin1,2()
Received:2025-06-23
Online:2026-06-11
Published:2026-06-12
Contact:
SU Laijin
摘要:
本文探究了不同采收期对莼菜主要成分含量的影响,采用主成分分析法,综合评价其最佳品质期,为莼菜的加工利用与可持续发展提供科学依据。结果表明,莼菜嫩叶和老叶的水分含量最多,其中5月含量最高,分别达到98.71%和89.25%。6月嫩叶和老叶的粗多糖含量最高,分别达到108.9和93.6 g·kg-1。5月莼菜嫩叶和老叶的蛋白质含量最高,分别为4.8和33.0 g·kg-1。10月莼菜嫩叶和老叶的灰分含量最高,分别为1.3和17.0 g·kg-1。3种主要矿物质中,钙含量最高。10月的嫩叶和老叶中钙含量最高,分别为213.9和2 997.6 mg·kg-1。叶绿素和总类胡萝卜素含量变化趋势相似,其中5月莼菜嫩叶的叶绿素和总类胡萝卜素含量最高,分别为0.24和0.05 mg·g-1,老叶分别为1.56和0.38 mg·g-1。碳含量在5—7月持续上升,并在7月达到峰值,嫩叶和老叶的碳含量分别为28.66%和38.72%。主成分分析结果显示,5月采收的嫩叶和老叶综合品质最佳,该时期莼菜水分充足、蛋白质和矿物质含量丰富、新鲜度高。
中图分类号:
王嘉敏, 张旭, 吴明江, 苏来金. 基于主成分分析综合评价不同采收期的莼菜品质[J]. 浙江农业科学, 2026, 67(6): 1522-1528.
WANG Jiamin, ZHANG Xu, WU Mingjiang, SU Laijin. Comprehensive evaluation of quality of Brasenia schreberi at different harvesting periods based on principal component analysis[J]. Journal of Zhejiang Agricultural Sciences, 2026, 67(6): 1522-1528.
| 部位 | 采收期 | 水分含量/% | 灰分含量/(g·kg-1) | 蛋白质含量/(g·kg-1) | 粗多糖含量/(g·kg-1) |
|---|---|---|---|---|---|
| 莼菜嫩叶 | 5月 | 98.71±0.16 a | 1.1±0.2 ab | 4.8±0.1 a | 97.1±3.4 b |
| 6月 | 98.35±0.02 bc | 1.0±0 bc | 4.0±0.4 b | 108.9±6.7 a | |
| 7月 | 98.20±0.18 c | 0.8±0 c | 2.7±0.1 c | 94.1±5.2 b | |
| 8月 | 98.20±0.01 c | 0.8±0.1 c | 2.5±0.4 c | 71.2±1.6 c | |
| 9月 | 98.57±0.12 ab | 0.9±0.1 bc | 2.9±0.4 c | 77.7±4.3 c | |
| 10月 | 98.22±0.06 c | 1.3±0 a | 4.0±0.2 b | 97.6±1.6 b | |
| 莼菜老叶 | 5月 | 89.25±0.68 a | 13.9±0.7 b | 33.0±0.5 a | 58.5±0.9 b |
| 6月 | 88.76±0.52 a | 11.7±0.2 c | 20.6±0.3 c | 93.6±1.6 a | |
| 7月 | 88.05±0.98 ab | 11.3±0.6 cd | 19.3±1.0 cd | 41.8±1.6 d | |
| 8月 | 85.27±0.60 c | 10.5±0.1 d | 13.6±0.5 e | 40.2±1.0 d | |
| 9月 | 86.68±0.18 bc | 13.9±0.1 b | 18.5±0.7 d | 52.4±0.9 c | |
| 10月 | 86.68±0.40 bc | 17.0±0.5 a | 24.6±0.3 b | 56.1±1.6 b |
表1 不同采收期莼菜嫩叶和老叶的基本成分含量
Table 1 Basic composition of young leaves and old leaves of Brasenia schreberi at different harvesting periods
| 部位 | 采收期 | 水分含量/% | 灰分含量/(g·kg-1) | 蛋白质含量/(g·kg-1) | 粗多糖含量/(g·kg-1) |
|---|---|---|---|---|---|
| 莼菜嫩叶 | 5月 | 98.71±0.16 a | 1.1±0.2 ab | 4.8±0.1 a | 97.1±3.4 b |
| 6月 | 98.35±0.02 bc | 1.0±0 bc | 4.0±0.4 b | 108.9±6.7 a | |
| 7月 | 98.20±0.18 c | 0.8±0 c | 2.7±0.1 c | 94.1±5.2 b | |
| 8月 | 98.20±0.01 c | 0.8±0.1 c | 2.5±0.4 c | 71.2±1.6 c | |
| 9月 | 98.57±0.12 ab | 0.9±0.1 bc | 2.9±0.4 c | 77.7±4.3 c | |
| 10月 | 98.22±0.06 c | 1.3±0 a | 4.0±0.2 b | 97.6±1.6 b | |
| 莼菜老叶 | 5月 | 89.25±0.68 a | 13.9±0.7 b | 33.0±0.5 a | 58.5±0.9 b |
| 6月 | 88.76±0.52 a | 11.7±0.2 c | 20.6±0.3 c | 93.6±1.6 a | |
| 7月 | 88.05±0.98 ab | 11.3±0.6 cd | 19.3±1.0 cd | 41.8±1.6 d | |
| 8月 | 85.27±0.60 c | 10.5±0.1 d | 13.6±0.5 e | 40.2±1.0 d | |
| 9月 | 86.68±0.18 bc | 13.9±0.1 b | 18.5±0.7 d | 52.4±0.9 c | |
| 10月 | 86.68±0.40 bc | 17.0±0.5 a | 24.6±0.3 b | 56.1±1.6 b |
| 部位 | 采收期 | 铁 | 钙 | 钠 |
|---|---|---|---|---|
| 莼菜嫩叶 | 5月 | 5.1±1.7 a | 213.8±40.4 a | 40.3±3.1 c |
| 6月 | 5.0±1.8 a | 43.1±16.1 c | 35.7±11.4 d | |
| 7月 | 0.7±0.2 c | 10.9±3.7 d | 29.9±1.8 e | |
| 8月 | 1.4±0.6 b | 7.7±2.7 e | 29.8±4.2 e | |
| 9月 | 1.4±0.9 b | 55.4±5.3 b | 50.6±21.4 b | |
| 10月 | 5.1±2.4 a | 213.9±74.5 a | 52.1±17.0 a | |
| 莼菜老叶 | 5月 | 30.1±7.0 a | 2 997.5±74.3 a | 206.5±45.8 e |
| 6月 | 29.9±13.6 b | 603.5±40.9 b | 374.6±46.6 c | |
| 7月 | 29.8±11.6 b | 138.4±18.6 d | 583.1±51.2 a | |
| 8月 | 19.4±0.6 c | 73.6±25.3 e | 583.0±33.1 a | |
| 9月 | 14.1±1.3 d | 449.6±45.8 c | 497.6±52.3 b | |
| 10月 | 30.2±1.2 a | 299 7.6±187.2 a | 223.4±83.5 d |
表2 不同采收期莼菜嫩叶和老叶的主要矿物质含量 (mg·kg-1)
Table 2 Content of main minerals in young leaves and old leaves of Brasenia schreberi at different harvesting periods
| 部位 | 采收期 | 铁 | 钙 | 钠 |
|---|---|---|---|---|
| 莼菜嫩叶 | 5月 | 5.1±1.7 a | 213.8±40.4 a | 40.3±3.1 c |
| 6月 | 5.0±1.8 a | 43.1±16.1 c | 35.7±11.4 d | |
| 7月 | 0.7±0.2 c | 10.9±3.7 d | 29.9±1.8 e | |
| 8月 | 1.4±0.6 b | 7.7±2.7 e | 29.8±4.2 e | |
| 9月 | 1.4±0.9 b | 55.4±5.3 b | 50.6±21.4 b | |
| 10月 | 5.1±2.4 a | 213.9±74.5 a | 52.1±17.0 a | |
| 莼菜老叶 | 5月 | 30.1±7.0 a | 2 997.5±74.3 a | 206.5±45.8 e |
| 6月 | 29.9±13.6 b | 603.5±40.9 b | 374.6±46.6 c | |
| 7月 | 29.8±11.6 b | 138.4±18.6 d | 583.1±51.2 a | |
| 8月 | 19.4±0.6 c | 73.6±25.3 e | 583.0±33.1 a | |
| 9月 | 14.1±1.3 d | 449.6±45.8 c | 497.6±52.3 b | |
| 10月 | 30.2±1.2 a | 299 7.6±187.2 a | 223.4±83.5 d |
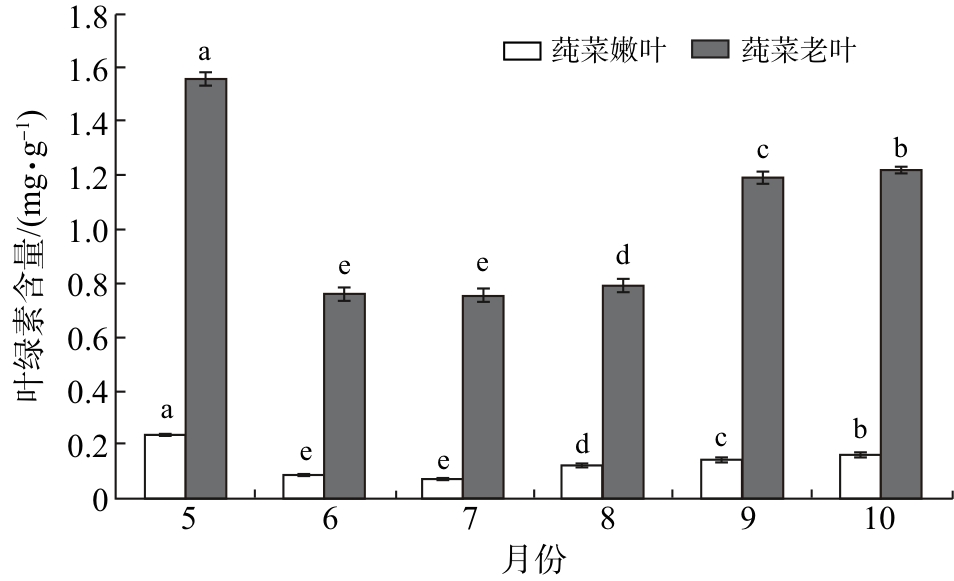
图1 不同采收期莼菜嫩叶和老叶的叶绿素含量同颜色柱无相同小写字母表示同一部位不同采收期之间差异显著(p<0.05),图2~3同。
Fig.1 Chlorophyll content of young leaves and old leaves of Brasenia schreberi at different harvesting periods
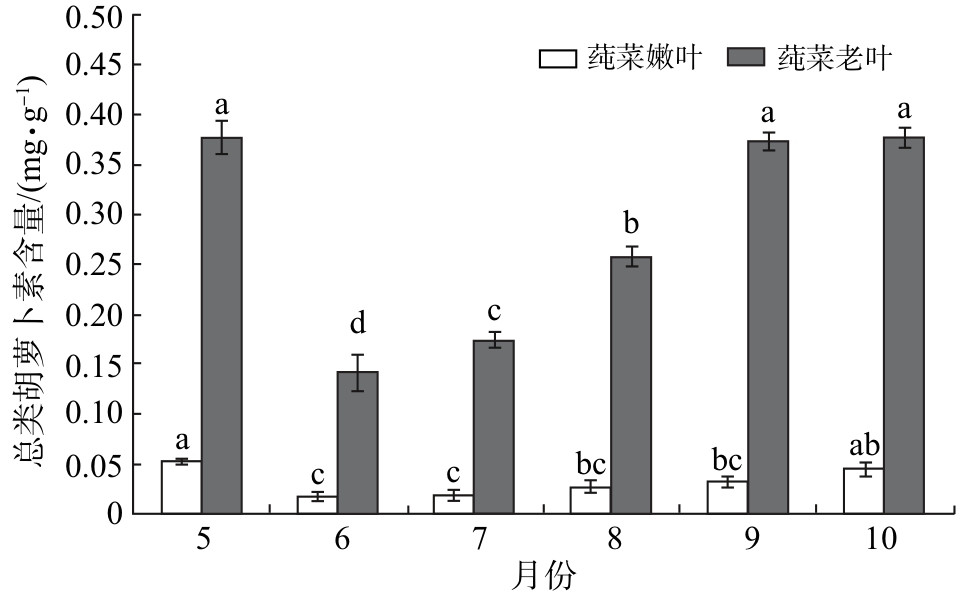
图2 不同采收期莼菜嫩叶和老叶的总类胡萝卜素含量
Fig.2 Total carotenoid content of young leaves and old leaves of Brasenia schreberi at different harvesting periods
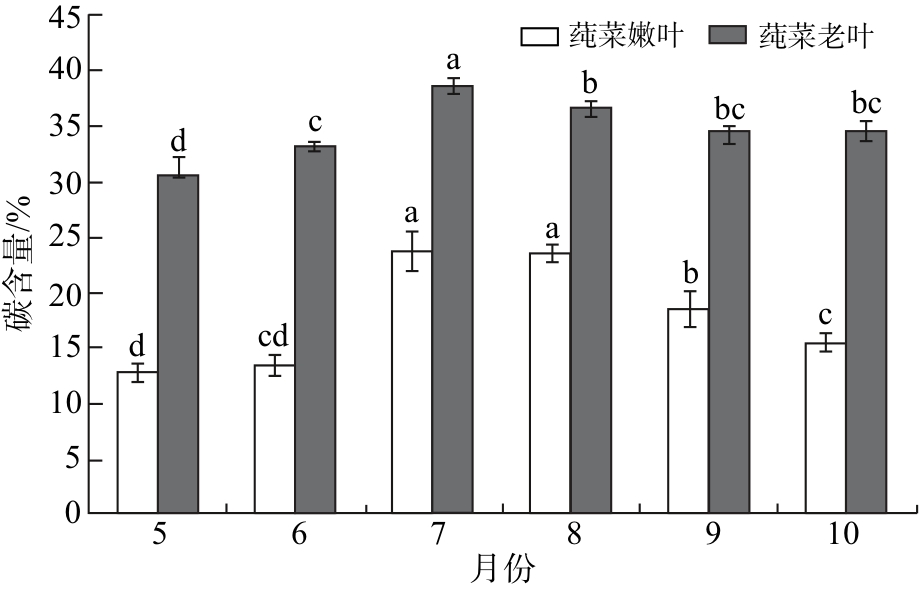
图3 不同采收期莼菜嫩叶和老叶的碳含量
Fig.3 Carbon content of young leaves and old leaves of Brasenia schreberi at different harvesting periods
| 评价指标 | 莼菜嫩叶 | 莼菜老叶 | ||
|---|---|---|---|---|
| PC1 | PC2 | PC1 | PC2 | |
| 水分含量 | 0.578 | 0.398 | 0.577 | -0.706 |
| 灰分含量 | 0.893 | -0.155 | 0.783 | 0.411 |
| 蛋白质含量 | 0.936 | -0.258 | 0.945 | -0.100 |
| 粗多糖含量 | 0.509 | -0.817 | 0.332 | -0.693 |
| 铁含量 | 0.881 | -0.404 | 0.521 | -0.634 |
| 钙含量 | 0.942 | 0.137 | 0.935 | 0.193 |
| 钠含量 | 0.632 | 0.303 | -0.955 | 0.032 |
| 叶绿素含量 | 0.795 | 0.543 | 0.833 | 0.452 |
| 总类胡萝卜素含量 | 0.803 | 0.536 | 0.543 | 0.829 |
| 碳含量 | -0.896 | 0.290 | -0.819 | 0.288 |
| 特征值 | 6.411 | 1.856 | 5.668 | 2.573 |
| 方差贡献率/% | 64.115 | 18.562 | 56.678 | 25.734 |
| 累计方差贡献率/% | 61.115 | 82.677 | 56.678 | 82.412 |
表3 莼菜嫩叶和老叶2个主成分的成分矩阵、特征值、方差贡献率及累计方差贡献率
Table 3 Component matrix,eigenvalues,variance contribution and cumulative variance contribution of the two principal components of young leaves and old leaves of Brasenia schreberi
| 评价指标 | 莼菜嫩叶 | 莼菜老叶 | ||
|---|---|---|---|---|
| PC1 | PC2 | PC1 | PC2 | |
| 水分含量 | 0.578 | 0.398 | 0.577 | -0.706 |
| 灰分含量 | 0.893 | -0.155 | 0.783 | 0.411 |
| 蛋白质含量 | 0.936 | -0.258 | 0.945 | -0.100 |
| 粗多糖含量 | 0.509 | -0.817 | 0.332 | -0.693 |
| 铁含量 | 0.881 | -0.404 | 0.521 | -0.634 |
| 钙含量 | 0.942 | 0.137 | 0.935 | 0.193 |
| 钠含量 | 0.632 | 0.303 | -0.955 | 0.032 |
| 叶绿素含量 | 0.795 | 0.543 | 0.833 | 0.452 |
| 总类胡萝卜素含量 | 0.803 | 0.536 | 0.543 | 0.829 |
| 碳含量 | -0.896 | 0.290 | -0.819 | 0.288 |
| 特征值 | 6.411 | 1.856 | 5.668 | 2.573 |
| 方差贡献率/% | 64.115 | 18.562 | 56.678 | 25.734 |
| 累计方差贡献率/% | 61.115 | 82.677 | 56.678 | 82.412 |
| 采收期 | 莼菜嫩叶 | 莼菜老叶 | ||||||
|---|---|---|---|---|---|---|---|---|
| Y1 | Y2 | Y | 排名 | Y3 | Y4 | Y' | 排名 | |
| 5月 | 3.35 | 0.73 | 2.28 | 1 | 3.22 | 0.04 | 1.83 | 1 |
| 6月 | 0.21 | -2.27 | -0.28 | 4 | -0.17 | -2.65 | -0.78 | 4 |
| 7月 | -2.81 | -0.64 | -1.92 | 6 | -1.55 | -1.08 | -1.16 | 5 |
| 8月 | -2.62 | 0.91 | -1.51 | 5 | -3.20 | 1.15 | -1.52 | 6 |
| 9月 | -0.53 | 1.52 | -0.06 | 3 | -0.54 | 1.53 | 0.09 | 3 |
| 10月 | 2.40 | -0.24 | 1.50 | 2 | 2.24 | 1.01 | 1.53 | 2 |
表4 不同采收期莼菜嫩叶和老叶主成分得分、综合得分及排名
Table 4 Principal component score,comprehensive score and ranking of young leaves and old leaves of Brasenia schreberi at different harvesting periods
| 采收期 | 莼菜嫩叶 | 莼菜老叶 | ||||||
|---|---|---|---|---|---|---|---|---|
| Y1 | Y2 | Y | 排名 | Y3 | Y4 | Y' | 排名 | |
| 5月 | 3.35 | 0.73 | 2.28 | 1 | 3.22 | 0.04 | 1.83 | 1 |
| 6月 | 0.21 | -2.27 | -0.28 | 4 | -0.17 | -2.65 | -0.78 | 4 |
| 7月 | -2.81 | -0.64 | -1.92 | 6 | -1.55 | -1.08 | -1.16 | 5 |
| 8月 | -2.62 | 0.91 | -1.51 | 5 | -3.20 | 1.15 | -1.52 | 6 |
| 9月 | -0.53 | 1.52 | -0.06 | 3 | -0.54 | 1.53 | 0.09 | 3 |
| 10月 | 2.40 | -0.24 | 1.50 | 2 | 2.24 | 1.01 | 1.53 | 2 |
| [1] | 栾迪. 莼菜体外胶多糖降血糖组分分离及其降血糖机理研究[D]. 杭州:浙江工业大学,2020. |
| LUAN D. Isolation and hypoglycemic mechanism effect of polysacchaide from Brasenia schreberi [D]. Hangzhou:Zhejiang University of Technology,2020. | |
| [2] | 于丹. 中国北部莼菜(Brasenia schreberi)地史分布与生态适应[J]. 植物研究,1991,11(4):99-105. |
| YU D. The geo:historical distribution and ecological adaptation of Brasenia schreberi in north China[J]. Bulletin of Botanical Research,1991,11(4):99-105. | |
| [3] | 唐璜. 出口莼菜及类似产品风险预警探究[J]. 南方农业,2017,11(30):91-93. |
| TANG H. Study on risk early warning of export water shield and similar products[J]. South China Agriculture,2017,11(30):91-93. | |
| [4] | 郭文场,周淑荣,董昕瑜,等. 莼菜的栽植管理与综合利用(3)[J]. 特种经济动植物,2018,21(10):39-43. |
| GUO W C, ZHOU S R, DONG X Y,et al. Planting management and comprehensive utilization of water shield(3)[J]. Special Economic Animals and Plants,2018,21(10):39-43. | |
| [5] | 李燕,柯剑鸿,焦大春,等. 莼菜的营养价值及其应用研究进展[J]. 长江蔬菜,2018(18):36-39. |
| LI Y, KE J H, JIAO D C,et al. Research progress on nutritional value and application of Brasenia schreberi [J]. Journal of Changjiang Vegetables,2018(18):36-39. | |
| [6] | 吕家龙,祝金明,董伟敏,等. 西湖莼菜卷叶及其胶质中营养成分的研究[J]. 营养学报,1996,18(2):238-240. |
| LYU J L, ZHU J M, DONG W M,et al. Study on the nutrients in the curled leaves and gum of water shield in West Lake[J]. Acta Nutrimenta Sinica,1996,18(2):238-240. | |
| [7] | 彭静,柯卫东,叶元英,等. 317份水生蔬菜种质资源品质性状分析[C]//全国蔬菜遗传育种学术讨论会论文集. 2002:30-37. |
| [8] | LU Y H, HUANG J H, LI Y C,et al. Variation in nutritional compositions,antioxidant activity and microstructure of Lycopus lucidus Turcz. root at different harvest times[J]. Food Chemistry,2015,183:91-100. |
| [9] | YUAN N, SUN L, DU S,et al. Effects of harvesting period and storage duration on volatile organic compounds and nutritive qualities of alfalfa[J]. Agriculture,2022,12(8):1115. |
| [10] | GRACE M H, YOUSEF G G, GUSTAFSON S J,et al. Phytochemical changes in phenolics,anthocyanins,ascorbic acid,and carotenoids associated with sweetpotato storage and impacts on bioactive properties[J]. Food Chemistry,2014,145:717-724. |
| [11] | PARSONS T R, MAITA Y,et al. A manual of chemical and biological methods for seawater analysis[M]. New York:Pergamon Press,1984. |
| [12] | 宁泽光. 砂培环境下镉对花生幼苗根系活力和叶绿素含量的影响研究[J]. 基层农技推广,2023,11(10):30-38. |
| NING Z G. Effects of cadmium on root activity and chlorophyll content of peanut seedlings in sand culture environment[J]. Primary Agricultural Technology Extension,2023,11(10):30-38. | |
| [13] | 马正然,姜启兴,许艳顺,等. 羊栖菜在热烫处理过程中的色泽变化[J]. 食品与生物技术学报,2016,35(10):1106-1112. |
| MA Z R, JIANG Q X, XU Y S,et al. Research on the color changes of Sargassum fusiforme during blanching treatment[J]. Journal of Food Science and Biotechnology,2016,35(10):1106-1112. | |
| [14] | 谢春. 环境因子对莼菜生长的影响及优质莼菜种源筛选[D]. 南京:南京大学,2019. |
| XIE C. Effects of environmental factors on growth of Brasenia schreberi and selection of high germplasm resources of the species[D]. Nanjing:Nanjing University,2019. | |
| [15] | 唐巧玉,周毅峰,吴永尧. 莼菜水溶性多糖提取工艺优化研究[J]. 北方园艺,2008(3):40-41. |
| TANG Q Y, ZHOU Y F, WU Y Y. Extraction technology of water soluble polysaccharide of Brasenia schreberi [J]. Northern Horticulture,2008(3):40-41. | |
| [16] | 喻阳华,李一彤,吴银菇,等. 土壤养分与叶功能性状对顶坛花椒果皮品质的影响[J]. 森林与环境学报,2023,43(1):8-16. |
| YU Y H, LI Y T, WU Y G,et al. Effects of soil and leaf traits on peel quality of Zanthoxylum planispinum ‘Dintanensis’[J]. Journal of Forest and Environment,2023,43(1):8-16. | |
| [17] | 邓梦雅,朱丽,吴东慧,等. 蔬菜中矿物质含量测定、营养评价及风险评估[J]. 食品研究与开发,2018,39(9):97-102. |
| DENG M Y, ZHU L, WU D H,et al. Mineral content and nutritional value evaluation and risk assessment in vegetables[J]. Food Research and Development,2018,39(9):97-102. | |
| [18] | 孟庆翔. 矿物质在肉牛饲养中的作用[J]. 饲料工业,2022,43(24):1-8. |
| MENG Q X. The role of minerals in beef cattle feeding[J]. Feed Industry,2022,43(24):1-8. | |
| [19] | EKHOLM P, REINIVUO H, MATTILA P,et al. Changes in the mineral and trace element contents of cereals,fruits and vegetables in Finland[J]. Journal of Food Composition and Analysis,2007,20(6):487-495. |
| [20] | KONCZAK I, ROULLE P. Nutritional properties of commercially grown native Australian fruits:lipophilic antioxidants and minerals[J]. Food Research International,2011,44(7):2339-2344. |
| [21] | MIRDEHGHAN S H, RAHEMI M. Seasonal changes of mineral nutrients and phenolics in pomegranate(Punica granatum L.)fruit[J]. Scientia Horticulturae,2007,111(2):120-127. |
| [22] | 李迎春,杨清平,陈双林,等. 光照对多花黄精生长、光合和叶绿素荧光参数特征的影响[J]. 植物研究,2014,34(6):776-781. |
| LI Y C, YANG Q P, CHEN S L,et al. Effect of light intensity on growth,photosynthetic and fluorescence characteristics of Polygonatum cyrtonema [J]. Bulletin of Botanical Research,2014,34(6):776-781. | |
| [23] | 顾妍,尹莲,孙玉东,等. 不同温度对大白菜叶绿素含量的影响[J]. 安徽农业科学,2025,53(1):35-39. |
| GU Y, YIN L, SUN Y D,et al. Effect of different temperature on chlorophyll content of Chinese cabbage[J]. Journal of Anhui Agricultural Sciences,2025,53(1):35-39. | |
| [24] | 崔庆梅,吴利荣,陈斐,等. 高温胁迫对黄瓜幼苗生理生化及光合作用的影响[J]. 延安大学学报(自然科学版),2021,40(1):23-26,31. |
| CUI Q M, WU L R, CHEN F,et al. Effect of high temperature stress on physiological and biochemical characteristics and photosynthesis of Cucumis sativus L. seedlings[J]. Journal of Yanan University(Natural Science Edition),2021,40(1):23-26,31. | |
| [25] | 高一航,张艳,李勋. 甘孜州丹巴县柏树林下七种植物碳含量研究[J]. 现代农业研究,2024,30(11):92-96. |
| GAO Y H, ZHANG Y, LI X. Study on carbon content of seven plants under cypress forest in Danba area of Ganzi prefecture[J]. Modern Agriculture Research,2024,30(11):92-96. | |
| [26] | 李响,袁志友,焦峰. 温度和降水对中国草本植物、灌木和乔木养分重吸收特征的影响[J]. 水土保持研究,2023,30(2):87-92. |
| LI X, YUAN Z Y, JIAO F. Response of nutrient resorption of herbs,shrubs and trees to temperature and precipitation in China[J]. Research of Soil and Water Conservation,2023,30(2):87-92. | |
| [27] | 宋亮平,楚新正,杨晶. 艾比湖湿地边缘带典型植物固碳能力研究[J]. 干旱区地理,2016,39(1):136-143. |
| SONG L P, CHU X Z, YANG J. Carbon sequestration capacity of typical plants in marginal zone of the Ebinur Lake wetland[J]. Arid Land Geography,2016,39(1):136-143. | |
| [28] | 张韵. 三沙湾湿地主要植被的固碳能力及修复进展研究[D]. 青岛:中国海洋大学,2013. |
| ZHANG Y. Study on carbon storage of dominant vegetation and restoration in Sansha Bay[D]. Qingdao:Ocean University of China,2013. | |
| [29] | SCHULTZ R, ANDREWS S, O' REILLY L,et al. Plant community composition more predictive than diversity of carbon cycling in freshwater wetlands[J]. Wetlands,2011,31(5):965-977. |
| [30] | 汪海翔,杜春江,魏溱,等. 基于主成分分析的通海乌天麻适宜采收期研究[J]. 云南农业大学学报(自然科学版),2024(2):101-107. |
| WANG H X, DU C J, WEI Q’,et al. Study on the suitable harvest period of Gastrodia elata Bl. in Tonghai based on principal component analysis[J]. Journal of Yunnan Agricultural University(Natural Science),2024(2):101-107. | |
| [31] | 孙博位,孙怡宁,原鹏强,等. 基于主成分分析综合评价不同采收期五味子果实品质[J]. 北方园艺,2024(11):97-105. |
| SUN B W, SUN Y N, YUAN P Q,et al. Comprehensive evaluation of fruit quality of Schisandra chinensis at different harvesting periods based on principal component analysis[J]. Northern Horticulture,2024(11):97-105. |
| [1] | 王曙禄, 俞浙萍, 梁森苗, 孙鹂, 宋洋, 戚行江, 张淑文. 设施水肥一体化对杨梅生长及果实品质的影响[J]. 浙江农业科学, 2026, 67(6): 1333-1336. |
| [2] | 张智雄, 黄金道, 张波, 梁森苗. 春季修剪与叶面营养对杨梅坐果率和果实品质的影响[J]. 浙江农业科学, 2026, 67(6): 1337-1341. |
| [3] | 雷康琦, 杨晗, 吴玉勇, 戚烨通, 张林, 姚莹, 周慧芬. 两株解钾菌对杨梅果实品质的影响[J]. 浙江农业科学, 2026, 67(6): 1349-1354. |
| [4] | 吴碧波, 王蓉, 徐沁怡, 郑柯斌, 吴降星, 仇强强, 叶小明, 樊树雷. 不同覆盖方式对杨梅微环境与经济性状的影响[J]. 浙江农业科学, 2026, 67(6): 1355-1359. |
| [5] | 倪晓军, 梁森苗. 设施隔膜对山地杨梅产量及果实品质的影响[J]. 浙江农业科学, 2026, 67(6): 1360-1365. |
| [6] | 张佳佳. 不同生草类型对山地杨梅园土壤性状和果实特性的影响[J]. 浙江农业科学, 2026, 67(6): 1366-1370. |
| [7] | 张建斌, 吴玉勇, 应铮峥, 孙鹂, 张淑文, 杨晗, 李家胜, 俞巧梅. 类球红细菌代谢产物对杨梅生长和果实品质的影响[J]. 浙江农业科学, 2026, 67(6): 1371-1377. |
| [8] | 王仙忠, 张杨, 梁森苗. 无醇杨梅酒脱醇工艺比较及其发展策略[J]. 浙江农业科学, 2026, 67(6): 1389-1394. |
| [9] | 潘善祥, 黄金道, 梁森苗. “三改一统”技术对高山杨梅产量与果实品质的影响[J]. 浙江农业科学, 2026, 67(6): 1395-1399. |
| [10] | 罗磊, 张晋睿, 刘泽亮, 王斐, 蒋梓航, 赵春芳, 陈新红. 孕穗期外施硒肥对粳稻产量及品质的影响[J]. 浙江农业科学, 2026, 67(6): 1427-1433. |
| [11] | 周小燕, 郭勤卫, 徐璐珊, 王佳俊. 基于不同茶树品种原料的青柑茶品质分析[J]. 浙江农业科学, 2026, 67(6): 1474-1479. |
| [12] | 张波, 黄金道, 张智雄, 梁森苗. 树形对红美人杂柑生长及果实品质的影响[J]. 浙江农业科学, 2026, 67(6): 1507-1510. |
| [13] | 吴昊, 李俊兵, 徐继根, 张顺昌, 沈宣才, 骆徐汇, 何风杰, 程建徽. 不同基肥对葡萄园土壤理化性质及果实品质的影响[J]. 浙江农业科学, 2026, 67(6): 1511-1517. |
| [14] | 邵洁, 陆益军. 复合菌剂与多元微生物菌肥在草莓绿色生产中的应用效果[J]. 浙江农业科学, 2026, 67(6): 1518-1521. |
| [15] | 白培贤, 师大亮, 敖存, 赵芸, 崔宏春. 机采叶红茶品质提升加工工艺优化研究[J]. 浙江农业科学, 2026, 67(6): 1543-1550. |
| 阅读次数 | ||||||
|
全文 |
|
|||||
|
摘要 |
|
|||||